Marshall: Fire Incidents, Minnesota (MN)
Where are fire incidents reported in Marshall, MN
Something went wrong! Please refresh the page.
|
| |||||||||||||||||||||||||||||||||||||||||||||||||||||||||||||||||||||||||||||||||||||||||||||||||||||||||||||
2002 - 2018 National Fire Incident Reporting System (NFIRS) incidents
- Incident types reported to NFIRS in Marshall, MN
- 66943.7%Fire
- 23615.4%Hazardous Condition
- 22814.9%False Alarm
- 18211.9%Rescue & EMS
- 1479.6%Good Intent Call
- 603.9%Service Call
- 60.4%Overpressure Rupture
- 20.1%Severe Weather
- Fire incident types reported to NFIRS in Marshall, MN
- 29143.5%Structure Fires
- 22533.6%Outside Fires
- 11316.9%Mobile Property/Vehicle Fires
- 406.0%Other
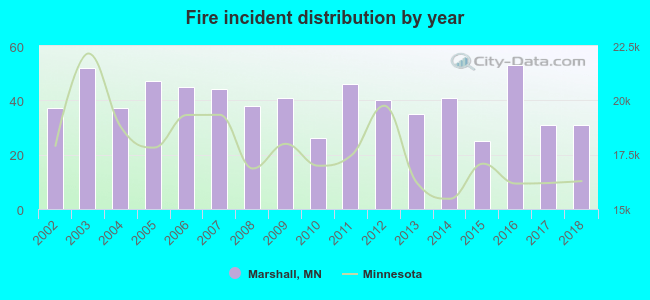 According to the data from the years 2002 - 2018 the average number of fire incidents per year is 39. The highest number of fire incidents - 53 took place in 2016, and the least - 25 in 2015. The data has a decreasing trend.
The average number of yearly fire incidents per 10k residents in Marshall, MN compared to nearest cities:
(Note: Based on data for the last 3 years, including only cities with population 5,000 and above)
| Marshall: | 28.1 |
| Redwood Falls: | 31.0 |
| Montevideo: | 26.8 |
 The median response time based on all reported fire incidents is 5 minutes. This is lower compared to the state median value.
The median response time in Marshall, MN compared to nearest cities:
(Note: Based on data for all years, including only cities with at least 500 fire incidents)
| Marshall: | 5 minutes |
 30.3% incidents where reported in the morning and 69.7% in the evening. The most fires (16.4%) took place on Saturday, and the least (12.3%) on Monday.
 Based on the 669 fires from years 2002 - 2018 most fires (13.0%) took place during October, and the least (5.5%) in January.
 Out of all 1,531 cases reported during the years 2002 - 2018, the most belonged to the categories: Fire (43.7%), Hazardous Condition (15.4%), and False Alarm (14.9%).
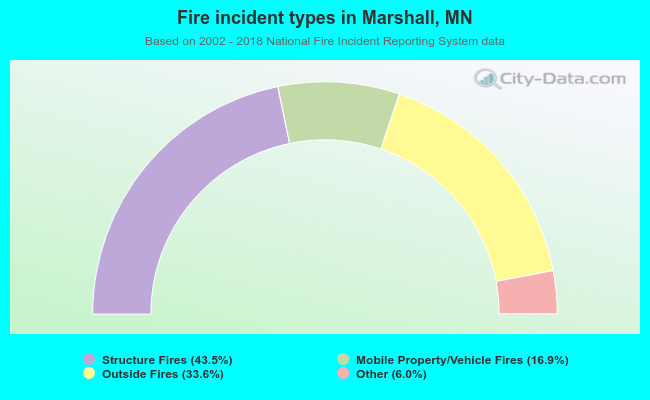 When looking into fire subcategories, the most incidents belonged to: Structure Fires (43.5%), and Outside Fires (33.6%).