Long Branch: Fire Incidents, New Jersey (NJ)
Where are fire incidents reported in Long Branch, NJ
Something went wrong! Please refresh the page.
| Fire incidents reported | |
|---|---|
| Sreet name | Count |
| OCEAN AVE | 448 |
| BROADWAY | 350 |
| OCEAN BLVD | 196 |
| BRIGHTON AVE | 136 |
| THIRD AVE | 136 |
| BATH AVE | 130 |
| CHELSEA AVE | 128 |
| SECOND AVE | 126 |
| ATLANTIC AVE | 124 |
| ROCKWELL AVE | 110 |
| CEDAR AVE | 90 |
| JOLINE AVE | 90 |
| MORRIS AVE | 82 |
| PAVILION AVE | 78 |
| UNION AVE | 76 |
| BELMONT AVE | 74 |
| BRANCHPORT AVE | 68 |
| NORWOOD AVE | 68 |
| WESTWOOD AVE | 66 |
| LONG BRANCH AVE | 50 |
| LIBERTY ST | 48 |
| WILLOW AVE | 48 |
| SIXTH AVE | 46 |
| WEST END AVE | 46 |
| 2ND AVE | 40 |
| PATTEN AVE | 40 |
| 3RD AVE | 36 |
| SAIRS AVE | 36 |
| SEVENTH AVE | 34 |
| AVENEL BLVD | 32 |
2003 - 2018 National Fire Incident Reporting System (NFIRS) incidents
- Incident types reported to NFIRS in Long Branch, NJ
- 5,42743.7%Hazardous Condition
- 2,77522.3%False Alarm
- 2,62621.1%Fire
- 6575.3%Rescue & EMS
- 4703.8%Good Intent Call
- 4383.5%Service Call
- Fire incident types reported to NFIRS in Long Branch, NJ
- 1,84670.3%Structure Fires
- 59222.5%Outside Fires
- 1626.2%Mobile Property/Vehicle Fires
- 261.0%Other
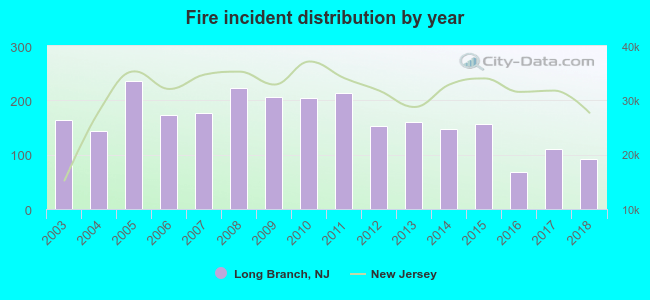 Based on the data from the years 2003 - 2018 the average number of fires per year is 164. The highest number of reported fires - 236 took place in 2005, and the least - 68 in 2016. The data has a decreasing trend.
The average number of yearly fire incidents per 10k residents in Long Branch, NJ compared to nearest cities:
(Note: Based on data for the last 3 years, including only cities with population 5,000 and above)
| Long Branch: | 29.6 |
| West Long Branch: | 4.2 |
| Oceanport: | 26.3 |
| Eatontown: | 35.6 |
| Little Silver: | 11.3 |
| Fair Haven: | 13.2 |
| Rumson: | 33.0 |
| Red Bank: | 28.4 |
| Asbury Park: | 53.2 |
 The median response time based on all reported fire incidents is 3 minutes. This is lower than the state median value.
The median response time in Long Branch, NJ compared to nearest cities:
(Note: Based on data for all years, including only cities with at least 500 fire incidents)
| Long Branch: | 3 minutes |
| West Long Branch: | 4 minutes |
| Oakhurst: | 5 minutes |
| Eatontown: | 5 minutes |
| Asbury Park: | 3 minutes |
| Tinton Falls: | 7 minutes |
| Manasquan: | 5 minutes |
| Keyport: | 4 minutes |
| Matawan: | 4 minutes |
 According to the reports from the years 2003 - 2018 the average number of fire-related fatalities per year is 0. The highest number of deaths - 4 took place in 2015, and the lowest - 0 in 2003. The data has a constant trend.
The average number of fatalities per 1,000 fire incidents is 2. This indicator was the highest - 26 in 2015, and the lowest 0 in 2003. The trend for fatalities per 1,000 fires is constant. Compared to the state value the number of fatalities per 1,000 fire incidents is higher.
According to the reports from the years 2003 - 2018 the average number of fire-related fatalities per year is 0. The highest number of deaths - 4 took place in 2015, and the lowest - 0 in 2003. The data has a constant trend.
The average number of fatalities per 1,000 fire incidents is 2. This indicator was the highest - 26 in 2015, and the lowest 0 in 2003. The trend for fatalities per 1,000 fires is constant. Compared to the state value the number of fatalities per 1,000 fire incidents is higher.Deaths per 1,000 incidents in Long Branch, NJ compared to nearest cities:
(Note: Based on data for all years, including only cities with at least 2,500 fire incidents)
| Long Branch: | 2.3 |
| Perth Amboy: | 2.4 |
 Based on the data from the years 2003 - 2018 the average number of fire-related yearly casualties is 1. The highest number of reported injuries - 4 took place in 2009, and the lowest - 0 in 2004. The data has a dropping trend.
The average number of casualties per 1,000 fires is 7. This indicator was the highest - 26 in 2015, and the lowest 0 in 2004. The trend for casualties per 1,000 fires is declining. Compared to the state value the number of injuries per 1,000 fire incidents is similar.
Based on the data from the years 2003 - 2018 the average number of fire-related yearly casualties is 1. The highest number of reported injuries - 4 took place in 2009, and the lowest - 0 in 2004. The data has a dropping trend.
The average number of casualties per 1,000 fires is 7. This indicator was the highest - 26 in 2015, and the lowest 0 in 2004. The trend for casualties per 1,000 fires is declining. Compared to the state value the number of injuries per 1,000 fire incidents is similar.Casualties per 1,000 incidents in Long Branch, NJ compared to nearest cities:
(Note: Based on data for all years, including only cities with at least 500 fire incidents)
| Long Branch: | 7.6 |
| West Long Branch: | 0.0 |
| Oakhurst: | 5.8 |
| Eatontown: | 26.9 |
| Asbury Park: | 11.6 |
| Tinton Falls: | 5.5 |
| Manasquan: | 7.1 |
| Keyport: | 20.6 |
| Matawan: | 8.2 |
 29.7% incidents where reported in the morning and 70.3% in the evening. The most fires (16.1%) took place on Sunday, and the least (13.0%) on Wednesday.
 According to the 2,626 fire incident reports from years 2003 - 2018 most fires (9.9%) took place during July, and the least (7.1%) in February.
 Out of all 12,422 cases reported during the years 2003 - 2018, the most belonged to the categories: Hazardous Condition (43.7%), False Alarm (22.3%), and Fire (21.1%).
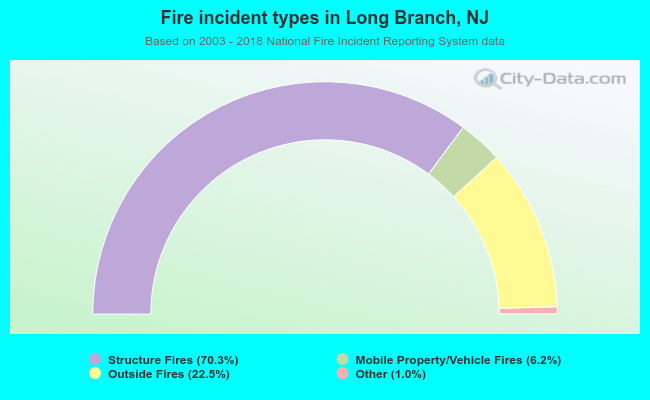 When looking into fire subcategories, the most incidents belonged to: Structure Fires (70.3%), and Outside Fires (22.5%).