Litchfield: Fire Incidents, New Hampshire (NH)
Where are fire incidents reported in Litchfield, NH
Something went wrong! Please refresh the page.
|
| |||||||||||||||||||||||||||||||||||||||||||||||||||||||||||||||||||||||||||||||||||||||||||||||||||||||||||||
2003 - 2018 National Fire Incident Reporting System (NFIRS) incidents
- Incident types reported to NFIRS in Litchfield, NH
- 2,63751.9%Rescue & EMS
- 81015.9%Service Call
- 62812.4%Hazardous Condition
- 3637.1%False Alarm
- 3206.3%Good Intent Call
- 3086.1%Fire
- 130.3%Severe Weather
- Fire incident types reported to NFIRS in Litchfield, NH
- 17356.2%Structure Fires
- 10433.8%Outside Fires
- 216.8%Mobile Property/Vehicle Fires
- 103.2%Other
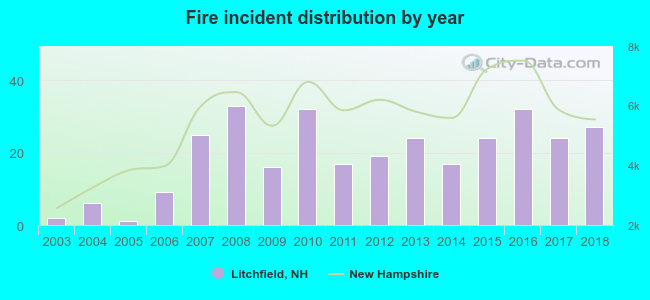 Based on the data from the years 2003 - 2018 the average number of fire incidents per year is 19. The highest number of reported fire incidents - 33 took place in 2008, and the least - 1 in 2005. The data has a growing trend.
The average number of yearly fire incidents per 10k residents in Litchfield, NH compared to nearest cities:
(Note: Based on data for the last 3 years, including only cities with population 5,000 and above)
| Litchfield: | 33.5 |
| Merrimack: | 28.8 |
| Londonderry: | 72.8 |
| Hudson: | 59.1 |
| Nashua: | 30.6 |
| Bedford: | 24.5 |
| Derry: | 46.6 |
| Amherst: | 21.4 |
| Windham: | 29.7 |

 26.6% incidents where reported in the morning and 73.4% in the evening. The most fires (17.9%) took place on Monday, and the least (10.1%) on Wednesday.
 Based on the 308 fire incident reports from years 2003 - 2018 most fires (14.0%) took place during May, and the least (4.2%) in October.
 Out of all 5,084 cases reported during the years 2003 - 2018, the most belonged to the categories: Rescue & EMS (51.9%), Service Call (15.9%), and Hazardous Condition (12.4%).
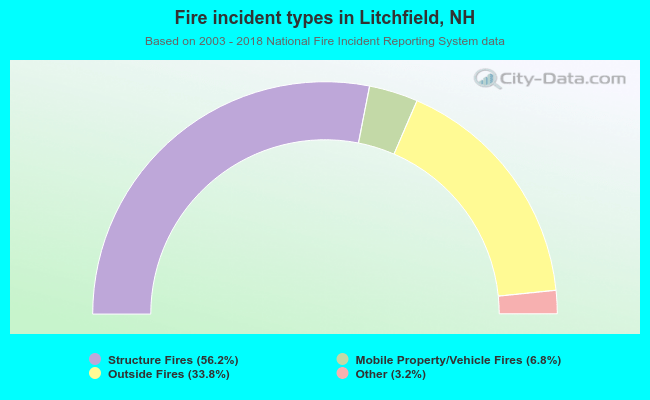 When looking into fire subcategories, the most reports belonged to: Structure Fires (56.2%), and Outside Fires (33.8%).