Linwood: Fire Incidents, New Jersey (NJ)
Where are fire incidents reported in Linwood, NJ
Something went wrong! Please refresh the page.
|
| |||||||||||||||||||||||||||||||||||||||||||||||||||||||||||||||||||||||||||||||||||||||||||||||||||||||||||||
2003 - 2018 National Fire Incident Reporting System (NFIRS) incidents
- Incident types reported to NFIRS in Linwood, NJ
- 79950.1%Hazardous Condition
- 37723.7%False Alarm
- 18311.5%Fire
- 935.8%Service Call
- 825.1%Good Intent Call
- 352.2%Severe Weather
- 201.3%Rescue & EMS
- 30.2%Special Incident
- 20.1%Overpressure Rupture
- Fire incident types reported to NFIRS in Linwood, NJ
- 8948.6%Structure Fires
- 5530.1%Outside Fires
- 2614.2%Other
- 137.1%Mobile Property/Vehicle Fires
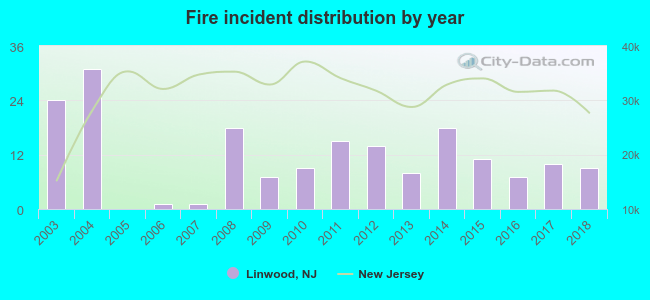 Based on the data from the years 2003 - 2018 the average number of fire incidents per year is 11. The highest number of fires - 31 took place in 2004, and the least - 0 in 2005. The data has a dropping trend.
The average number of yearly fire incidents per 10k residents in Linwood, NJ compared to nearest cities:
(Note: Based on data for the last 3 years, including only cities with population 5,000 and above)
| Linwood: | 12.3 |
| Northfield: | 31.0 |
| Somers Point: | 43.1 |
| Margate City: | 34.2 |
| Pleasantville: | 46.4 |
| Ocean City: | 41.3 |
| Absecon: | 17.1 |
| Atlantic City: | 61.0 |
| Pomona: | 23.9 |

 27.9% incidents where reported in the morning and 72.1% in the evening. The most fires (19.7%) took place on Saturday, and the least (9.8%) on Tuesday.
 According to the 183 incident reports from years 2003 - 2018 most fires (13.1%) took place during June, and the least (3.8%) in July.
 Out of all 1,594 cases reported during the years 2003 - 2018, the most belonged to the categories: Hazardous Condition (50.1%), False Alarm (23.7%), and Fire (11.5%).
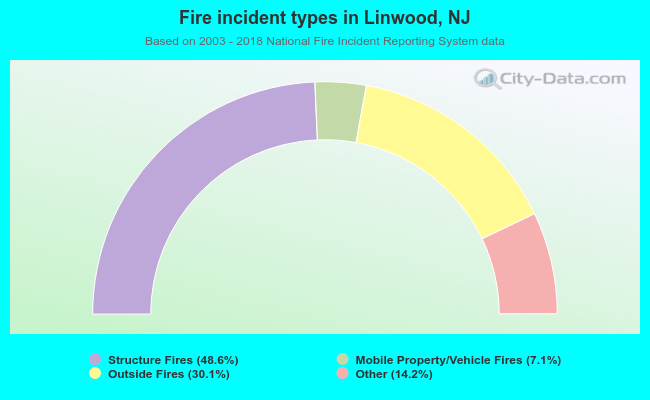 When looking into fire subcategories, the most incidents belonged to: Structure Fires (48.6%), and Outside Fires (30.1%).