Liberty Lake: Fire Incidents, Washington (WA)
Where are fire incidents reported in Liberty Lake, WA
Something went wrong! Please refresh the page.
|
| |||||||||||||||||||||||||||||||||||||||||||||||||||||||||||||||||||||||||||||||||||||||||||||||||||||||||||||
2002 - 2018 National Fire Incident Reporting System (NFIRS) incidents
- Incident types reported to NFIRS in Liberty Lake, WA
- 1,57955.1%Rescue & EMS
- 46616.3%Good Intent Call
- 2177.6%Fire
- 2057.2%Service Call
- 1966.8%False Alarm
- 1936.7%Hazardous Condition
- 60.2%Overpressure Rupture
- 30.1%Special Incident
- Fire incident types reported to NFIRS in Liberty Lake, WA
- 9041.5%Outside Fires
- 6027.6%Mobile Property/Vehicle Fires
- 3817.5%Structure Fires
- 2913.4%Other
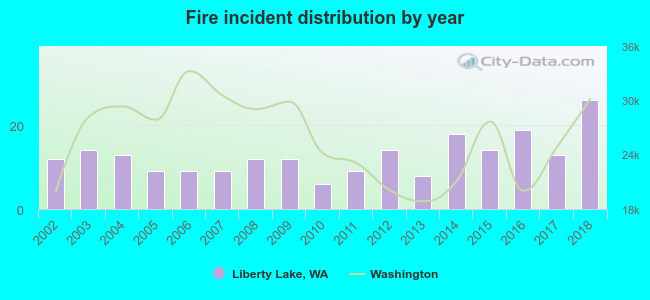 According to the data from the years 2002 - 2018 the average number of fire incidents per year is 13. The highest number of fire incidents - 26 took place in 2018, and the least - 6 in 2010. The data has an increasing trend.
The average number of yearly fire incidents per 10k residents in Liberty Lake, WA compared to nearest cities:
(Note: Based on data for the last 3 years, including only cities with population 5,000 and above)
| Liberty Lake: | 22.4 |
| Veradale: | 2.0 |
| Spokane Valley: | 34.0 |
| Mead: | 13.3 |
| Spokane: | 48.3 |
| Colbert: | 10.8 |
| Airway Heights: | 76.4 |
| Cheney: | 72.1 |
| Loon Lake: | 15.7 |
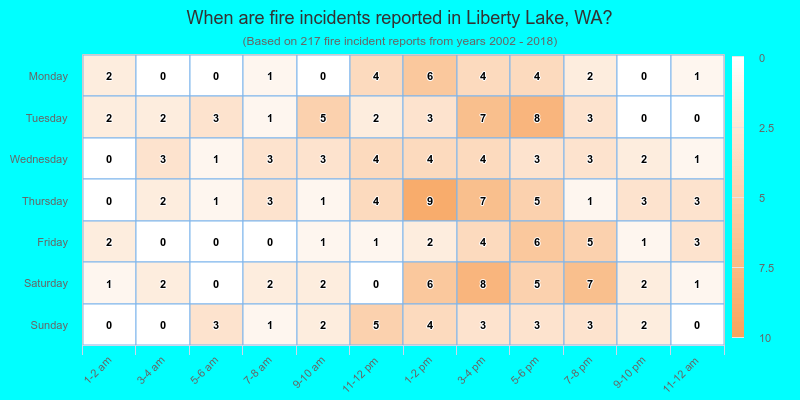
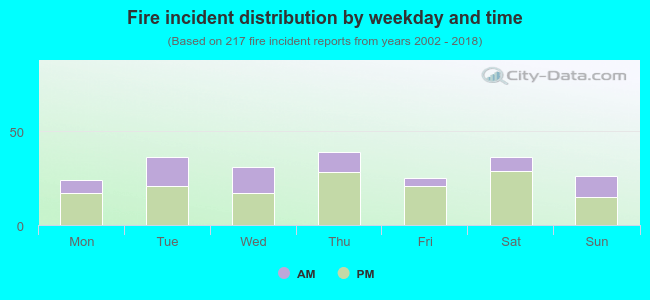 31.8% incidents where reported in the morning and 68.2% in the evening. The most fires (18.0%) took place on Thursday, and the least (11.1%) on Monday.
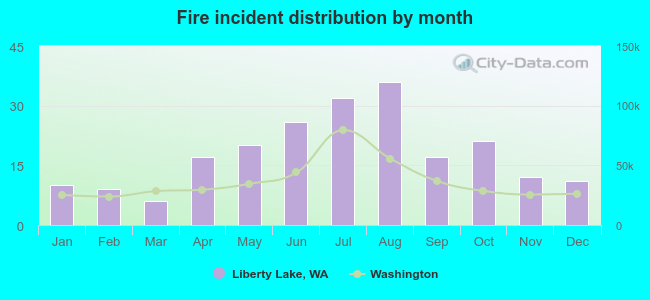 Based on the 217 fire incidents from years 2002 - 2018 most fires (16.6%) took place during August, and the least (2.8%) in March.
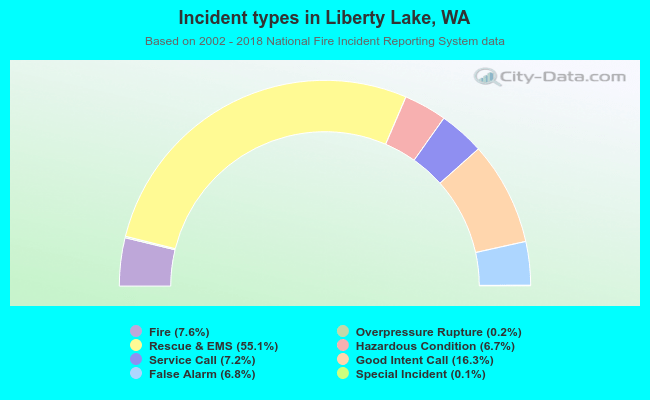 Out of all 2,865 cases reported during the years 2002 - 2018, the most belonged to the categories: Rescue & EMS (55.1%), Good Intent Call (16.3%), and Fire (7.6%).
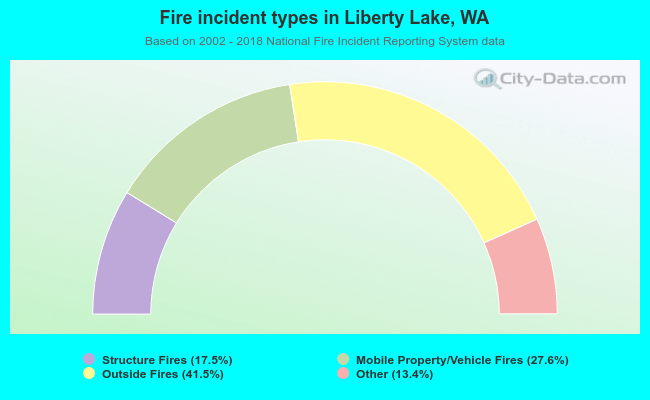 When looking into fire subcategories, the most incidents belonged to: Outside Fires (41.5%), and Mobile Property/Vehicle Fires (27.6%).