Ladson: Fire Incidents, South Carolina (SC)
Where are fire incidents reported in Ladson, SC
Something went wrong! Please refresh the page.
| Fire incidents reported | |
|---|---|
| Sreet name | Count |
| COLLEGE PARK RD | 138 |
| LADSON RD | 114 |
| ROYLE RD | 68 |
| HIGHWAY 78 | 52 |
| ACRES DR | 50 |
| TEMPLE RD | 50 |
| MARYLAND DR | 46 |
| MARGARET DR | 42 |
| MICKLER DR | 34 |
| OUTWOOD ST | 34 |
| CRAVEN RD | 30 |
| CROSSWATCH DR | 28 |
| OLD FORT DR | 28 |
| OXFORD RD | 28 |
| PINEWOOD DR | 28 |
| HWY 78ROADODD TO 10191 | 26 |
| TALL PINES RD | 26 |
| TREELAND DR | 26 |
| MIAMI ST | 24 |
| WILHITE DR | 24 |
| HWY 78EVEN TO 10234 | 22 |
| I26 | 22 |
| PONDEROSA DR | 22 |
| FRANKIE LN | 20 |
| CINDY DR | 18 |
| ELLIOTT DR | 18 |
| FAIRVIEW DR | 18 |
| FLAMINGO DR | 18 |
| GAILMOOR DR | 18 |
| GARWOOD DR | 18 |
| Other | 368 |
2003 - 2018 National Fire Incident Reporting System (NFIRS) incidents
- Incident types reported to NFIRS in Ladson, SC
- 5,03756.7%Rescue & EMS
- 1,45816.4%Fire
- 1,18013.3%Good Intent Call
- 4855.5%False Alarm
- 3914.4%Hazardous Condition
- 2913.3%Service Call
- 240.3%Special Incident
- 120.1%Severe Weather
- Fire incident types reported to NFIRS in Ladson, SC
- 78754.0%Structure Fires
- 44530.5%Outside Fires
- 16911.6%Mobile Property/Vehicle Fires
- 573.9%Other
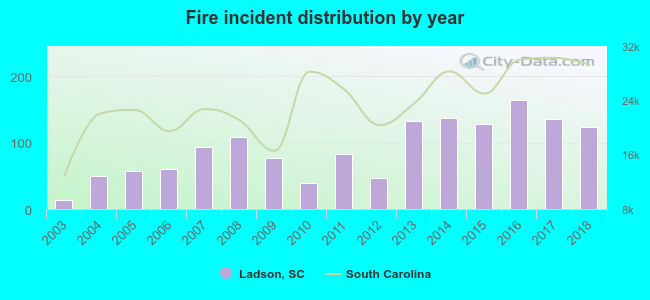 Based on the data from the years 2003 - 2018 the average number of fire incidents per year is 91. The highest number of reported fires - 164 took place in 2016, and the least - 13 in 2003. The data has a growing trend.
The average number of yearly fire incidents per 10k residents in Ladson, SC compared to nearest cities:
(Note: Based on data for the last 3 years, including only cities with population 5,000 and above)
| Ladson: | 102.5 |
| Summerville: | 100.5 |
| Goose Creek: | 39.1 |
| Hanahan: | 29.4 |
| North Charleston: | 73.9 |
| Moncks Corner: | 313.6 |
| Wando: | 18.9 |
| Charleston: | 56.7 |
| Cross: | 83.7 |
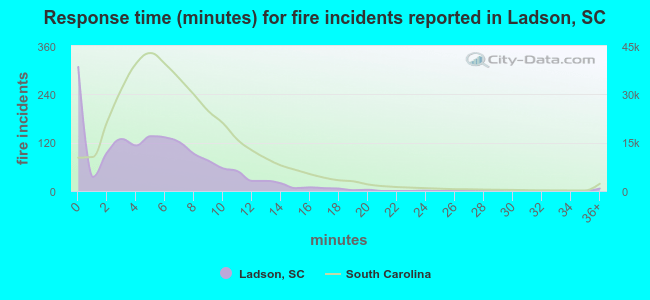 The median response time based on all reported fire incidents is 5 minutes. This is lower than the South Carolina median value.
The median response time in Ladson, SC compared to nearest cities:
(Note: Based on data for all years, including only cities with at least 500 fire incidents)
| Ladson: | 5 minutes |
| Summerville: | 6 minutes |
| Goose Creek: | 5 minutes |
| North Charleston: | 5 minutes |
| Ridgeville: | 9 minutes |
| Moncks Corner: | 5 minutes |
| Charleston: | 4 minutes |
| Cross: | 12 minutes |
| Hollywood: | 5 minutes |
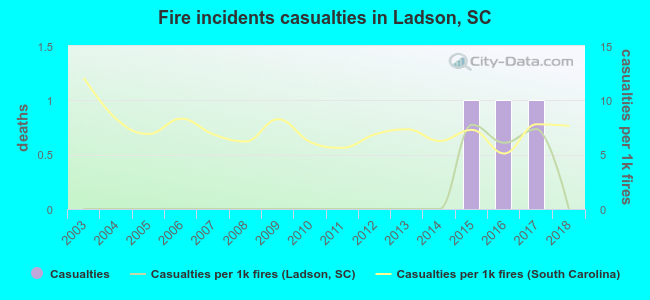 According to the data from the years 2003 - 2018 the average number of fire-related yearly casualties is 0. The highest number of casualties - 1 took place in 2015, and the lowest - 0 in 2003. The data has a constant trend.
The average number of casualties per 1,000 fires is 1. This indicator was the highest - 8 in 2015, and the lowest 0 in 2003. The trend for injuries per 1,000 fire incidents is constant. Compared to the state value the number of injuries per 1,000 incidents is much lower.
According to the data from the years 2003 - 2018 the average number of fire-related yearly casualties is 0. The highest number of casualties - 1 took place in 2015, and the lowest - 0 in 2003. The data has a constant trend.
The average number of casualties per 1,000 fires is 1. This indicator was the highest - 8 in 2015, and the lowest 0 in 2003. The trend for injuries per 1,000 fire incidents is constant. Compared to the state value the number of injuries per 1,000 incidents is much lower.Casualties per 1,000 incidents in Ladson, SC compared to nearest cities:
(Note: Based on data for all years, including only cities with at least 500 fire incidents)
| Ladson: | 2.1 |
| Summerville: | 7.6 |
| Goose Creek: | 13.3 |
| North Charleston: | 25.2 |
| Ridgeville: | 0.0 |
| Moncks Corner: | 3.3 |
| Charleston: | 7.7 |
| Cross: | 1.5 |
| Hollywood: | 0.0 |
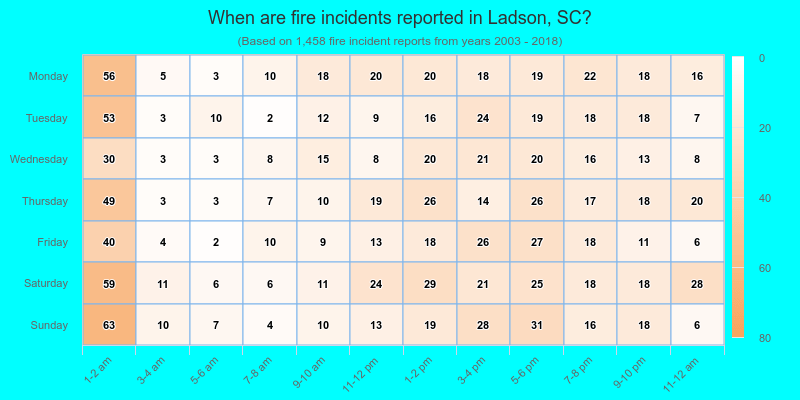
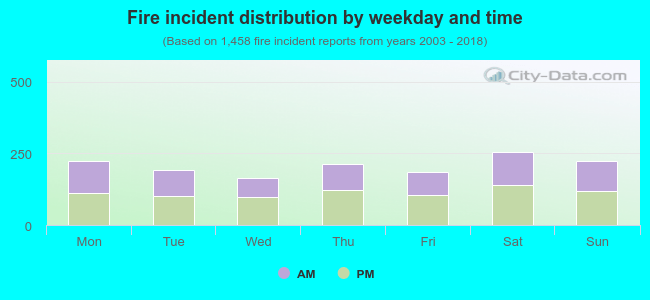 45.3% incidents where reported in the morning and 54.7% in the evening. The most fires (17.6%) took place on Saturday, and the least (11.3%) on Wednesday.
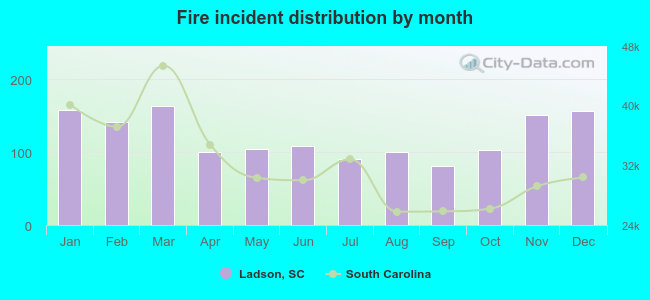 Based on the 1,458 reports from years 2003 - 2018 most fires (11.2%) took place during March, and the least (5.6%) in September.
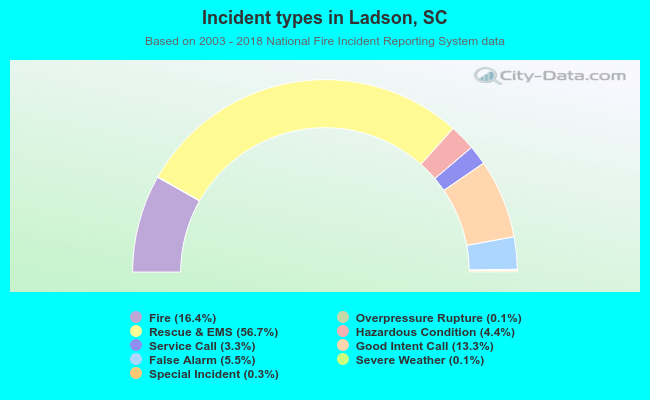 Out of all 8,886 cases reported during the years 2003 - 2018, the most belonged to the categories: Rescue & EMS (56.7%), Fire (16.4%), and Good Intent Call (13.3%).
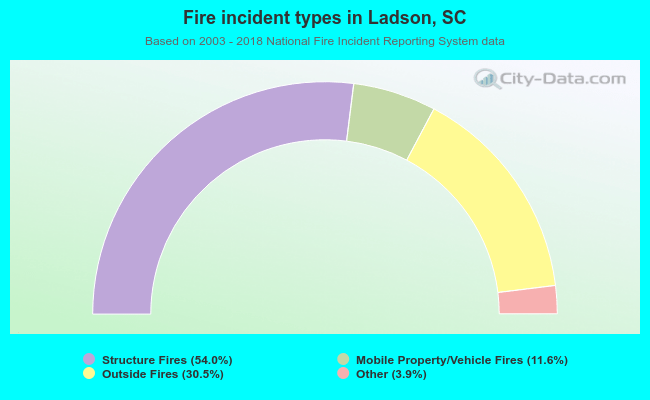 When looking into fire subcategories, the most incidents belonged to: Structure Fires (54.0%), and Outside Fires (30.5%).