Kirkland: Fire Incidents, Washington (WA)
Where are fire incidents reported in Kirkland, WA
Something went wrong! Please refresh the page.
| Fire incidents reported | |
|---|---|
| Sreet name | Count |
| 124TH ST | 162 |
| LAKE WASHINGTON BLVD | 140 |
| 132ND ST | 130 |
| 120TH AVE | 124 |
| 124TH AVE | 120 |
| KIRKLAND AVE | 118 |
| 85TH ST | 108 |
| 128TH ST | 106 |
| 68TH ST | 100 |
| 116TH AVE | 96 |
| JUANITA DR | 94 |
| 122ND ST | 88 |
| 6TH ST | 88 |
| 120TH ST | 84 |
| CENTRAL WAY | 78 |
| 116TH ST | 74 |
| 132ND AVE | 70 |
| SLATER AVE | 60 |
| LAKE ST | 58 |
| TOTEM LAKE BLVD | 56 |
| 108TH AVE | 54 |
| 122ND AVE | 48 |
| 60TH ST | 46 |
| NB405 | 44 |
| 100TH AVE | 42 |
| 130TH AVE | 42 |
| 4TH AVE | 36 |
| NB405 SOUTH OF | 34 |
| 117TH PL | 32 |
| 7TH AVE | 32 |
| Other | 490 |
2002 - 2018 National Fire Incident Reporting System (NFIRS) incidents
- Incident types reported to NFIRS in Kirkland, WA
- 15,92463.1%Rescue & EMS
- 2,85411.3%Fire
- 2,4999.9%Good Intent Call
- 1,8097.2%False Alarm
- 1,2635.0%Hazardous Condition
- 7573.0%Service Call
- 710.3%Special Incident
- Fire incident types reported to NFIRS in Kirkland, WA
- 1,26544.3%Structure Fires
- 86930.4%Outside Fires
- 39813.9%Other
- 32211.3%Mobile Property/Vehicle Fires
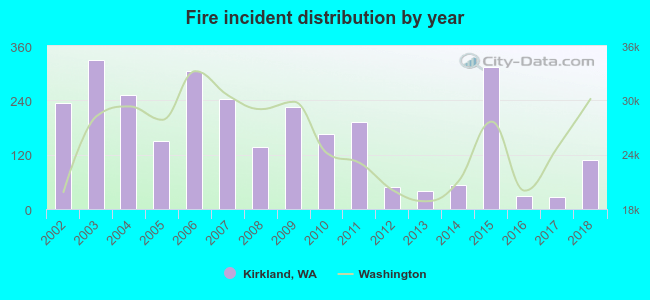 According to the data from the years 2002 - 2018 the average number of fires per year is 168. The highest number of reported fires - 328 took place in 2003, and the least - 27 in 2017. The data has a decreasing trend.
The average number of yearly fire incidents per 10k residents in Kirkland, WA compared to nearest cities:
(Note: Based on data for the last 3 years, including only cities with population 5,000 and above)
| Kirkland: | 6.4 |
| Redmond: | 21.2 |
| Woodinville: | 16.1 |
| Kenmore: | 14.5 |
| Bothell: | 32.5 |
| Bellevue: | 26.4 |
| Lake Forest Park: | 12.6 |
| Seattle: | 33.2 |
| Brier: | 10.4 |
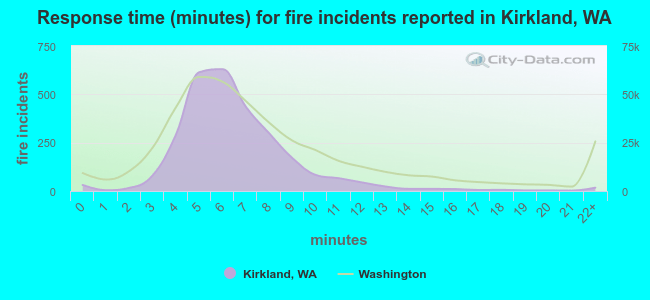 The median response time based on all reported fire incidents is 6 minutes. This is close to the Washington median value.
The median response time in Kirkland, WA compared to nearest cities:
(Note: Based on data for all years, including only cities with at least 500 fire incidents)
| Kirkland: | 6 minutes |
| Redmond: | 6 minutes |
| Woodinville: | 7 minutes |
| Kenmore: | 6 minutes |
| Bothell: | 6 minutes |
| Bellevue: | 6 minutes |
| Seattle: | 5 minutes |
| Mercer Island: | 6 minutes |
| Shoreline: | 7 minutes |
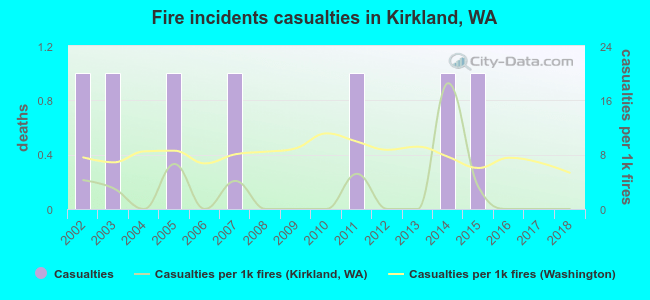 Based on the reports from the years 2002 - 2018 the average number of fire-related yearly casualties is 0. The highest number of reported injuries - 1 took place in 2002, and the lowest - 0 in 2004. The data has a decreasing trend.
The average number of injuries per 1,000 fires is 3. This indicator was the highest - 19 in 2014, and the lowest 0 in 2004. The trend for casualties per 1,000 fire incidents is declining. Compared to the Washington value the number of casualties per 1,000 fires is much lower.
Based on the reports from the years 2002 - 2018 the average number of fire-related yearly casualties is 0. The highest number of reported injuries - 1 took place in 2002, and the lowest - 0 in 2004. The data has a decreasing trend.
The average number of injuries per 1,000 fires is 3. This indicator was the highest - 19 in 2014, and the lowest 0 in 2004. The trend for casualties per 1,000 fire incidents is declining. Compared to the Washington value the number of casualties per 1,000 fires is much lower.Casualties per 1,000 incidents in Kirkland, WA compared to nearest cities:
(Note: Based on data for all years, including only cities with at least 500 fire incidents)
| Kirkland: | 2.5 |
| Redmond: | 7.6 |
| Woodinville: | 3.3 |
| Kenmore: | 7.4 |
| Bothell: | 10.0 |
| Bellevue: | 11.9 |
| Seattle: | 9.1 |
| Mercer Island: | 5.4 |
| Shoreline: | 19.2 |
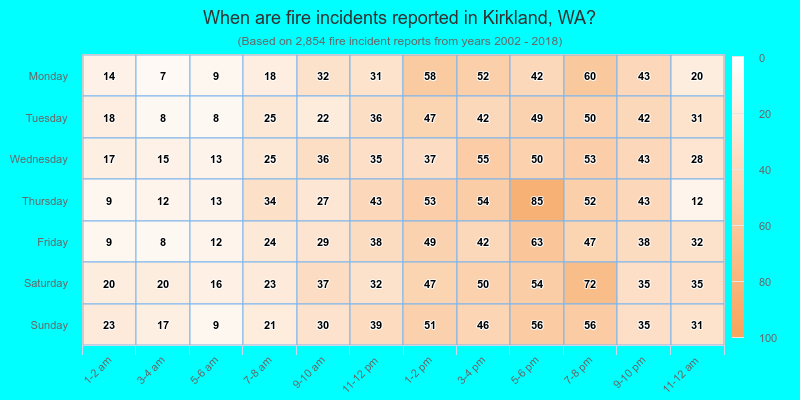
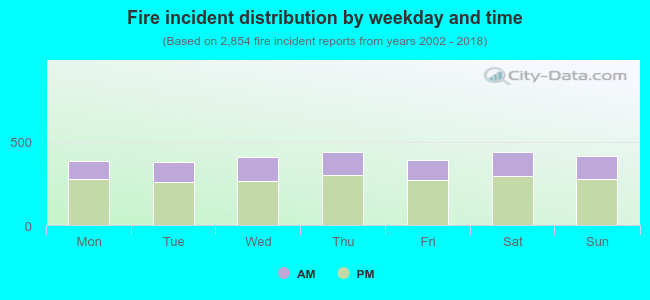 32.0% incidents where reported in the morning and 68.0% in the evening. The most fires (15.5%) took place on Saturday, and the least (13.2%) on Tuesday.
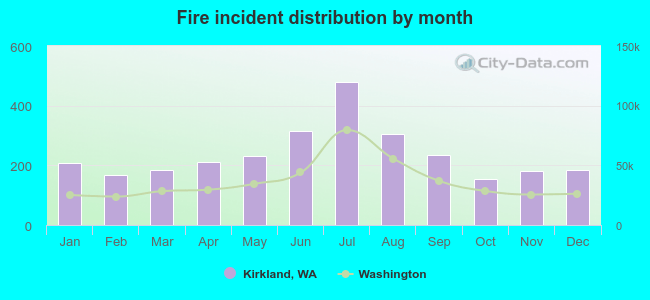 According to the 2,854 incident reports from years 2002 - 2018 most fires (16.8%) took place during July, and the least (5.4%) in October.
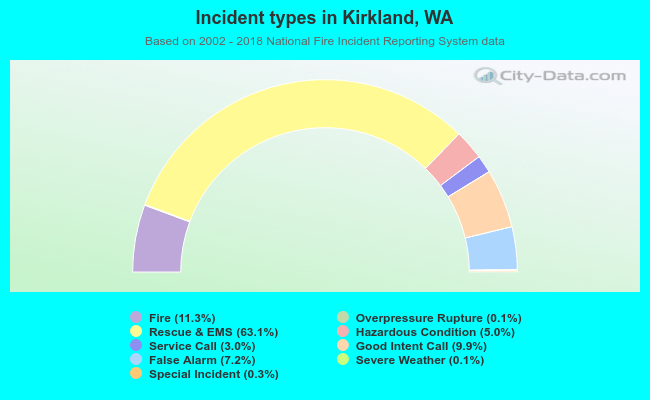 Out of all 25,223 cases reported during the years 2002 - 2018, the most belonged to the categories: Rescue & EMS (63.1%), Fire (11.3%), and Good Intent Call (9.9%).
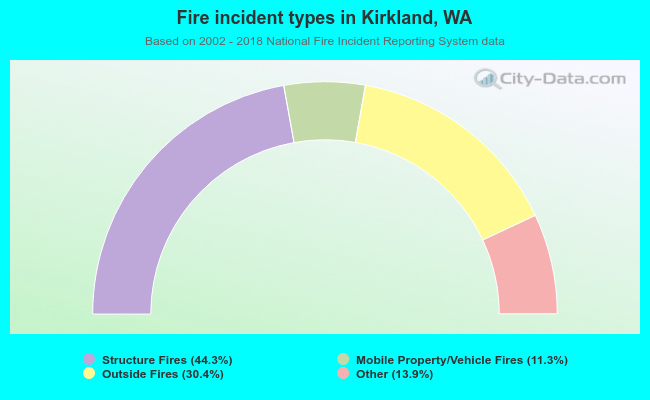 When looking into fire subcategories, the most incidents belonged to: Structure Fires (44.3%), and Outside Fires (30.4%).