Kingston: Fire Incidents, New York (NY)
Where are fire incidents reported in Kingston, NY
Something went wrong! Please refresh the page.
| Fire incidents reported | |
|---|---|
| Sreet name | Count |
| BROADWAY | 254 |
| ULSTER AVE | 244 |
| MAPLE LN | 202 |
| WASHINGTON AVE | 112 |
| ULSTER AVE | 110 |
| ROUTE 28 | 86 |
| ALBANY AVE | 80 |
| LUCAS AVE | 72 |
| NYS T-WAY | 68 |
| WALL ST | 62 |
| PLAZA RD | 60 |
| HENRY ST | 56 |
| LOCUST ST | 56 |
| FRANK SOTTILE BLVD | 50 |
| GARRAGHAN DR | 50 |
| CEDAR ST | 46 |
| DELAWARE AVE | 44 |
| FOXHALL AVE | 44 |
| RT 32 | 44 |
| ABEEL ST | 42 |
| CLINTON AVE | 40 |
| CORNELL ST | 38 |
| FLATBUSH AVE | 38 |
| PERRY HILL RD | 38 |
| ROUTE 209 | 38 |
| WASHINGTON AVE | 38 |
| BIRCH ST | 36 |
| ELMENDORF ST | 36 |
| HURLEY AVE | 36 |
| RONDOUT DR | 36 |
| Other | 577 |
2002 - 2018 National Fire Incident Reporting System (NFIRS) incidents
- Incident types reported to NFIRS in Kingston, NY
- 21,69155.8%Rescue & EMS
- 5,45314.0%Hazardous Condition
- 3,4158.8%Service Call
- 3,2098.3%False Alarm
- 2,7337.0%Fire
- 2,2695.8%Good Intent Call
- 590.2%Special Incident
- Fire incident types reported to NFIRS in Kingston, NY
- 1,40151.3%Structure Fires
- 73927.0%Outside Fires
- 45616.7%Mobile Property/Vehicle Fires
- 1375.0%Other
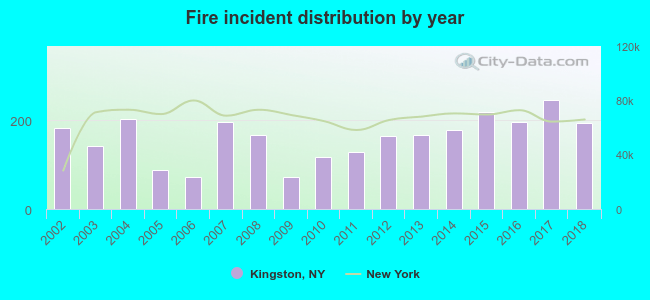 Based on the data from the years 2002 - 2018 the average number of fire incidents per year is 161. The highest number of fire incidents - 245 took place in 2017, and the least - 72 in 2009. The data has a rising trend.
The average number of yearly fire incidents per 10k residents in Kingston, NY compared to nearest cities:
(Note: Based on data for the last 3 years, including only cities with population 5,000 and above)
| Kingston: | 90.1 |
| Ulster: | 3.2 |
| Esopus: | 8.8 |
| Rosendale: | 3.8 |
| Marbletown: | 3.6 |
| Hyde Park: | 57.2 |
| New Paltz: | 63.6 |
| Fairview: | 1.8 |
| Highland: | 51.9 |
 The median response time based on all reported fire incidents is 3 minutes. This is lower than the New York median value.
The median response time in Kingston, NY compared to nearest cities:
(Note: Based on data for all years, including only cities with at least 500 fire incidents)
| Kingston: | 3 minutes |
| Hyde Park: | 7 minutes |
| New Paltz: | 5 minutes |
| Pleasant Valley: | 7 minutes |
| Poughkeepsie: | 5 minutes |
| Millbrook: | 10 minutes |
| Wappingers Falls: | 6 minutes |
 According to the reports from the years 2002 - 2018 the average number of fire-related fatalities per year is 0. The highest number of reported deaths - 1 took place in 2006, and the lowest - 0 in 2002. The data has a growing trend.
The average number of fatalities per 1,000 fires is 2. This indicator was the highest - 14 in 2006, and the lowest 0 in 2002. The trend for fatalities per 1,000 fires is rising. Compared to the New York value the number of fatalities per 1,000 fires is higher.
According to the reports from the years 2002 - 2018 the average number of fire-related fatalities per year is 0. The highest number of reported deaths - 1 took place in 2006, and the lowest - 0 in 2002. The data has a growing trend.
The average number of fatalities per 1,000 fires is 2. This indicator was the highest - 14 in 2006, and the lowest 0 in 2002. The trend for fatalities per 1,000 fires is rising. Compared to the New York value the number of fatalities per 1,000 fires is higher.Deaths per 1,000 incidents in Kingston, NY compared to nearest cities:
(Note: Based on data for all years, including only cities with at least 2,500 fire incidents)
| Kingston: | 1.5 |
| Poughkeepsie: | 1.1 |
 Based on the reports from the years 2002 - 2018 the average number of fire-related casualties per year is 3. The highest number of reported casualties - 14 took place in 2017, and the lowest - 0 in 2003. The data has an increasing trend.
The average number of injuries per 1,000 fire incidents is 19. This indicator was the highest - 67 in 2018, and the lowest 0 in 2003. The trend for casualties per 1,000 fires is rising. Compared to the New York value the number of casualties per 1,000 fire incidents is much higher.
Based on the reports from the years 2002 - 2018 the average number of fire-related casualties per year is 3. The highest number of reported casualties - 14 took place in 2017, and the lowest - 0 in 2003. The data has an increasing trend.
The average number of injuries per 1,000 fire incidents is 19. This indicator was the highest - 67 in 2018, and the lowest 0 in 2003. The trend for casualties per 1,000 fires is rising. Compared to the New York value the number of casualties per 1,000 fire incidents is much higher.Casualties per 1,000 incidents in Kingston, NY compared to nearest cities:
(Note: Based on data for all years, including only cities with at least 500 fire incidents)
| Kingston: | 20.5 |
| Hyde Park: | 1.8 |
| New Paltz: | 9.5 |
| Pleasant Valley: | 17.2 |
| Poughkeepsie: | 10.0 |
| Millbrook: | 0.0 |
| Wappingers Falls: | 4.4 |
 29.8% incidents where reported in the morning and 70.2% in the evening. The most fires (14.7%) took place on Wednesday, and the least (13.0%) on Tuesday.
 Based on the 2,733 reports from years 2002 - 2018 most fires (11.6%) took place during April, and the least (6.3%) in September.
 Out of all 38,877 cases reported during the years 2002 - 2018, the most belonged to the categories: Rescue & EMS (55.8%), Hazardous Condition (14.0%), and Service Call (8.8%).
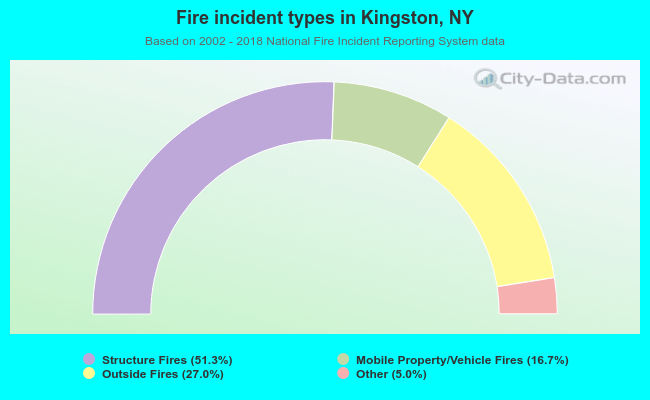 When looking into fire subcategories, the most reports belonged to: Structure Fires (51.3%), and Outside Fires (27.0%).