Kent: Fire Incidents, New York (NY)
Where are fire incidents reported in Kent, NY
Something went wrong! Please refresh the page.
|
| |||||||||||||||||||||||||||||||||||||||||||||||||||||||||||||||||||||||||||||||||||||||||||||||||||||||||||||
2002 - 2018 National Fire Incident Reporting System (NFIRS) incidents
- Incident types reported to NFIRS in Kent, NY
- 37341.6%Rescue & EMS
- 18320.4%Fire
- 11913.3%Good Intent Call
- 11112.4%Hazardous Condition
- 738.1%Service Call
- 343.8%False Alarm
- 30.3%Special Incident
- 10.1%Overpressure Rupture
- Fire incident types reported to NFIRS in Kent, NY
- 10557.4%Structure Fires
- 4826.2%Outside Fires
- 189.8%Other
- 126.6%Mobile Property/Vehicle Fires
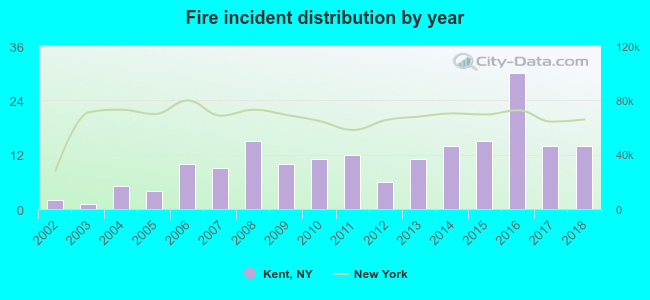 According to the data from the years 2002 - 2018 the average number of fires per year is 11. The highest number of reported fires - 30 took place in 2016, and the least - 1 in 2003. The data has an increasing trend.
The average number of yearly fire incidents per 10k residents in Kent, NY compared to nearest cities:
(Note: Based on data for the last 3 years, including only cities with population 5,000 and above)
| Kent: | 14.3 |
| Lake Carmel: | 4.8 |
| Patterson: | 48.8 |
| Southeast: | 3.3 |
| Carmel: | 19.4 |
| Mahopac: | 131.4 |
| East Fishkill: | 0.9 |
| Beekman: | 5.2 |
| Somers: | 9.8 |
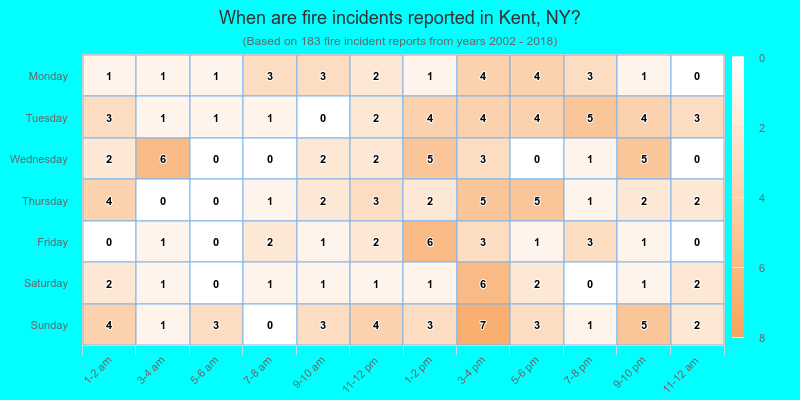
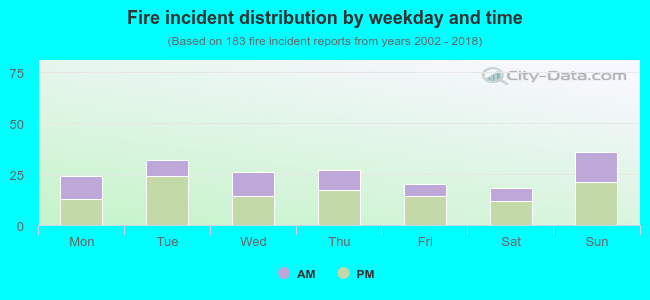 37.2% incidents where reported in the morning and 62.8% in the evening. The most fires (19.7%) took place on Sunday, and the least (9.8%) on Saturday.
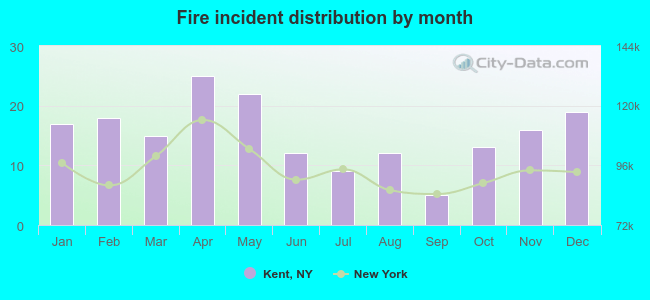 Based on the 183 incident reports from years 2002 - 2018 most fires (13.7%) took place during April, and the least (2.7%) in September.
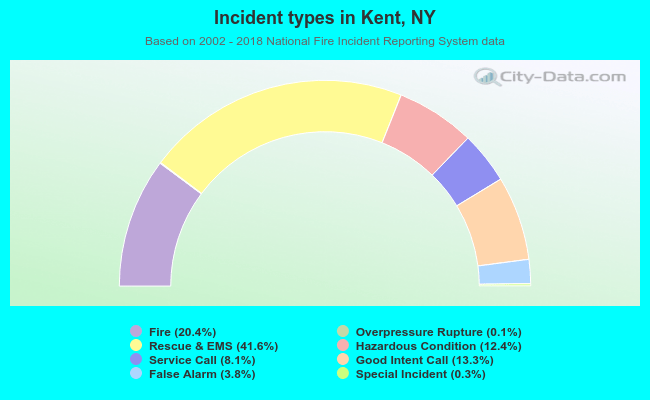 Out of all 897 cases reported during the years 2002 - 2018, the most belonged to the categories: Rescue & EMS (41.6%), Fire (20.4%), and Good Intent Call (13.3%).
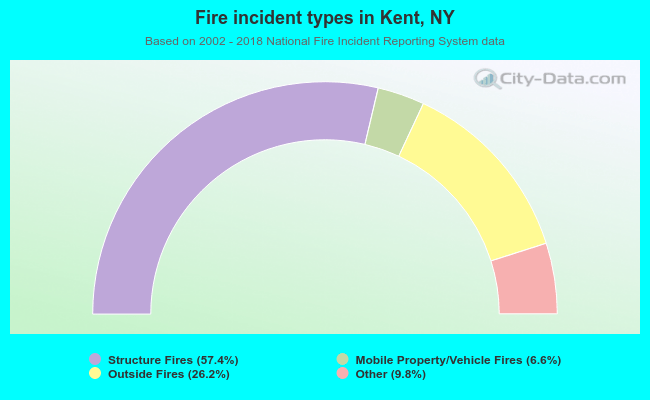 When looking into fire subcategories, the most reports belonged to: Structure Fires (57.4%), and Outside Fires (26.2%).