Keene: Fire Incidents, New Hampshire (NH)
Where are fire incidents reported in Keene, NH
Something went wrong! Please refresh the page.
| Fire incidents reported | |
|---|---|
| Sreet name | Count |
| COURT ST | 172 |
| MAIN ST | 98 |
| COURT ST | 92 |
| WEST ST | 92 |
| WEST ST | 86 |
| WINCHESTER ST | 64 |
| MAIN ST | 60 |
| MARLBORO ST | 54 |
| BUTLER CT | 52 |
| WASHINGTON ST | 50 |
| WINCHESTER ST | 50 |
| MAPLE AVE | 44 |
| PARK AVE | 42 |
| ROXBURY ST | 42 |
| ROUTE 9 | 40 |
| WATER ST | 40 |
| BUTLER CT | 38 |
| PARK AVE | 38 |
| WINTER ST | 38 |
| ASH BROOK RD | 36 |
| ELM ST | 34 |
| EMERALD ST | 34 |
| WASHINGTON ST | 34 |
| MAPLE AVE | 32 |
| WATER ST | 32 |
| CENTRAL SQ | 30 |
| PEARL ST | 30 |
| CENTRAL SQUARE | 28 |
| EMERALD ST | 28 |
| KEY RD | 28 |
| Other | 378 |
2002 - 2018 National Fire Incident Reporting System (NFIRS) incidents
- Incident types reported to NFIRS in Keene, NH
- 14,70258.4%Rescue & EMS
- 3,05012.1%False Alarm
- 2,2829.1%Hazardous Condition
- 2,0468.1%Service Call
- 1,9167.6%Fire
- 1,0854.3%Good Intent Call
- 550.2%Overpressure Rupture
- 300.1%Severe Weather
- Fire incident types reported to NFIRS in Keene, NH
- 1,13659.3%Structure Fires
- 45223.6%Outside Fires
- 1909.9%Mobile Property/Vehicle Fires
- 1387.2%Other
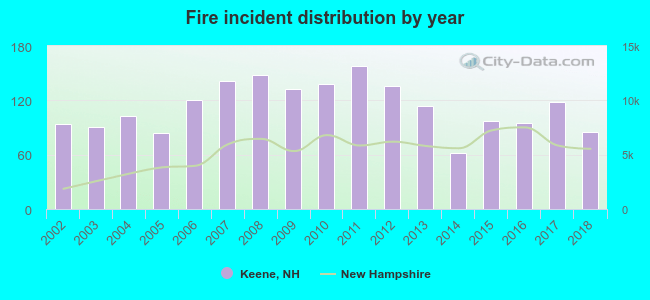 Based on the data from the years 2002 - 2018 the average number of fires per year is 113. The highest number of reported fires - 158 took place in 2011, and the least - 62 in 2014. The data has a decreasing trend.
The average number of yearly fire incidents per 10k residents in Keene, NH compared to nearest cities:
(Note: Based on data for the last 3 years, including only cities with population 5,000 and above)
| Keene: | 43.1 |
| Swanzey: | 49.3 |
| Rindge: | 53.8 |
| New Ipswich: | 59.5 |
 The median response time based on all reported fire incidents is 4 minutes. This is lower than the state median value.
The median response time in Keene, NH compared to nearest cities:
(Note: Based on data for all years, including only cities with at least 500 fire incidents)
| Keene: | 4 minutes |
| Rindge: | 12 minutes |
| Winchendon: | 5 minutes |
| Athol: | 5 minutes |
| Orange: | 7 minutes |
 Based on the reports from the years 2002 - 2018 the average number of fire-related yearly deaths is 0. The highest number of reported deaths - 2 took place in 2003, and the lowest - 0 in 2002. The data has a constant trend.
 Based on the data from the years 2002 - 2018 the average number of fire-related yearly casualties is 1. The highest number of casualties - 6 took place in 2002, and the lowest - 0 in 2003. The data has a dropping trend.
The average number of injuries per 1,000 fire incidents is 11. This indicator was the highest - 64 in 2002, and the lowest 0 in 2003. The trend for casualties per 1,000 fire incidents is declining. Compared to the New Hampshire value the number of casualties per 1,000 fire incidents is about the same.
Based on the data from the years 2002 - 2018 the average number of fire-related yearly casualties is 1. The highest number of casualties - 6 took place in 2002, and the lowest - 0 in 2003. The data has a dropping trend.
The average number of injuries per 1,000 fire incidents is 11. This indicator was the highest - 64 in 2002, and the lowest 0 in 2003. The trend for casualties per 1,000 fire incidents is declining. Compared to the New Hampshire value the number of casualties per 1,000 fire incidents is about the same.Casualties per 1,000 incidents in Keene, NH compared to nearest cities:
(Note: Based on data for all years, including only cities with at least 500 fire incidents)
| Keene: | 11.0 |
| Rindge: | 0.0 |
| Winchendon: | 10.0 |
| Athol: | 16.3 |
| Orange: | 12.2 |
 33.0% incidents where reported in the morning and 67.0% in the evening. The most fires (16.8%) took place on Friday, and the least (13.2%) on Tuesday.
 According to the 1,916 incident reports from years 2002 - 2018 most fires (12.3%) took place during April, and the least (6.5%) in February.
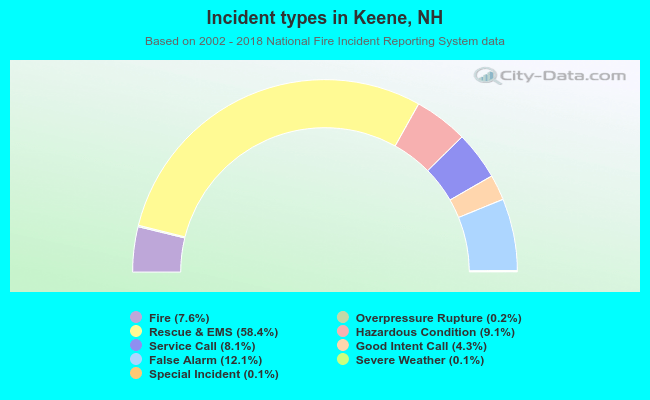 Out of all 25,189 cases reported during the years 2002 - 2018, the most belonged to the categories: Rescue & EMS (58.4%), False Alarm (12.1%), and Hazardous Condition (9.1%).
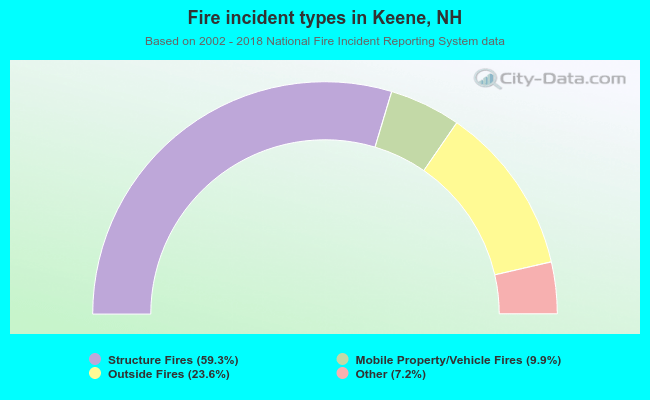 When looking into fire subcategories, the most incidents belonged to: Structure Fires (59.3%), and Outside Fires (23.6%).