| Fire incidents reported |
|---|
| Sreet name | Count |
|---|
| JERICHO TURNPIKE | 110 | | NORTH BROADWAY | 90 | | LONG ISLAND EXWY W/BD | 30 | | LONG ISLAND EXWY E/BD | 26 | | LONG ISLAND EXWY EBD | 18 | | LONG ISLAND EXWY WBD | 16 | | SOUTH SERVICE ROAD | 16 | | LONG ISLAND EXPY | 14 | | MANORS DRIVE | 14 | | NORTHERN STATE PKWY EB | 14 | | BIRCHWOOD PARK DRIVE | 12 | | CEDAR SWAMP ROAD | 12 | | HALSEY AVENUE | 12 | | JERICHO PLAZA | 12 | | JERICHO QUADRANGLE | 12 | | MAYTIME DRIVE | 12 | | ROBBINS LANE | 12 | | MERRY LANE | 10 | | WESTWOOD DRIVE | 10 | | FOXWOOD DRIVE | 8 | | LEAHY STREET | 8 | | NORTHERN STATE W/BD | 8 | | ROCKLAND DRIVE | 8 | | ROUTE 106 | 8 | | SOUTH MARGINAL ROAD | 8 |
| | | Fire incidents reported |
|---|
| Sreet name | Count |
|---|
| 17TH STREET | 6 | | BRUSH HOLLOW ROAD | 6 | | FERN DRIVE WEST | 6 | | HAZELWOOD DRIVE | 6 | | LIE OVERPASS | 6 | | MELLOW LANE | 6 | | NIMITZ STREET | 6 | | NORTHERN STATE E/BD | 6 | | NORTHERN STATE PKWY WB | 6 | | PARKSIDE DRIVE | 6 | | SULLIVAN DRIVE | 6 | | VILLAGE DRIVE | 6 | | WOODBRIDGE LANE | 6 | | 21ST STREET | 4 | | A GATE ROAD | 4 | | BIRCHWOOD PARK COURT | 4 | | BIRCHWOOD PARK CRESCENT | 4 | | BOUNTY LANE | 4 | | BRIAR LANE | 4 | | CANTIAGUE ROCK ROAD | 4 | | CRAIG STREET | 4 | | DELAWARE AVENUE | 4 | | ESTATE DRIVE | 4 | | FAIRHAVEN MALL | 4 | | FORSYTHIA LANE | 4 |
|
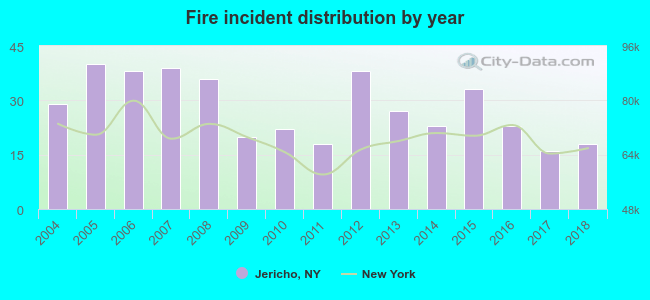 According to the data from the years 2004 - 2018 the average number of fire incidents per year is 28. The highest number of reported fires - 40 took place in 2005, and the least - 16 in 2017. The data has a declining trend.
 33.4% incidents where reported in the morning and 66.6% in the evening. The most fires (16.4%) took place on Tuesday, and the least (12.6%) on Monday.
 Based on the 422 fire incidents from years 2004 - 2018 most fires (11.8%) took place during May, and the least (5.7%) in February.
 Out of all 4,585 cases reported during the years 2004 - 2018, the most belonged to the categories: Rescue & EMS (38.5%), Hazardous Condition (22.1%), and False Alarm (17.7%).
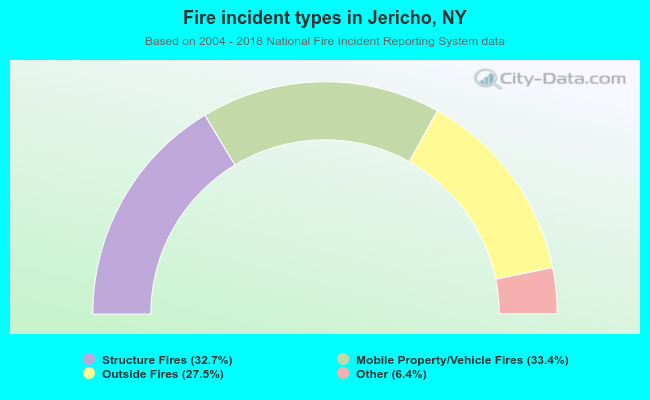 When looking into fire subcategories, the most incidents belonged to: Mobile Property/Vehicle Fires (33.4%), and Structure Fires (32.7%).