Jamestown: Fire Incidents, New York (NY)
Where are fire incidents reported in Jamestown, NY
Something went wrong! Please refresh the page.
| Fire incidents reported | |
|---|---|
| Sreet name | Count |
| 2ND ST | 258 |
| MAIN ST | 228 |
| FALCONER ST | 192 |
| 3RD ST | 170 |
| FOOTE AVE | 124 |
| ALLEN ST | 88 |
| 5TH ST | 86 |
| 8TH ST | 84 |
| 4TH ST | 80 |
| FOREST AVE | 74 |
| NEWLAND AVE | 74 |
| 6TH ST | 72 |
| PRENDERGAST AVE | 72 |
| BARROWS ST | 68 |
| WASHINGTON ST | 62 |
| BAKER ST | 60 |
| WINSOR ST | 60 |
| BENEDICT AVE | 56 |
| FAIRMOUNT AVE | 54 |
| BROADHEAD AVE | 52 |
| BUFFALO ST | 50 |
| SPRING ST | 50 |
| BARRETT AVE | 48 |
| LAFAYETTE ST | 48 |
| WILLARD ST | 48 |
| 7TH ST | 42 |
| GUSTAVUS AVE | 42 |
| HAZZARD ST | 38 |
| LAKEVIEW AVE | 38 |
| MCKINLEY AVE | 38 |
| Other | 19 |
2002 - 2018 National Fire Incident Reporting System (NFIRS) incidents
- Incident types reported to NFIRS in Jamestown, NY
- 18,78165.1%Rescue & EMS
- 2,5248.8%Hazardous Condition
- 2,4758.6%Fire
- 1,8646.5%Service Call
- 1,6215.6%False Alarm
- 1,3214.6%Good Intent Call
- 1670.6%Special Incident
- 530.2%Severe Weather
- 390.1%Overpressure Rupture
- Fire incident types reported to NFIRS in Jamestown, NY
- 1,19548.3%Structure Fires
- 59424.0%Outside Fires
- 46018.6%Other
- 2269.1%Mobile Property/Vehicle Fires
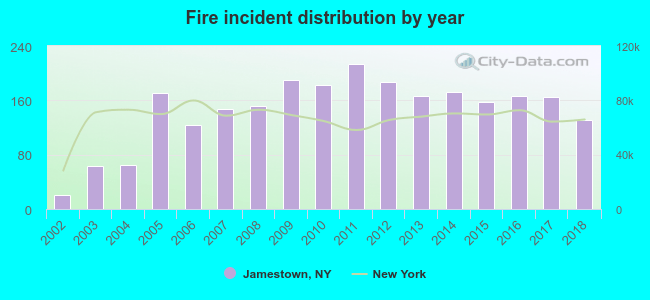 Based on the data from the years 2002 - 2018 the average number of fire incidents per year is 146. The highest number of fires - 214 took place in 2011, and the least - 21 in 2002. The data has a rising trend.
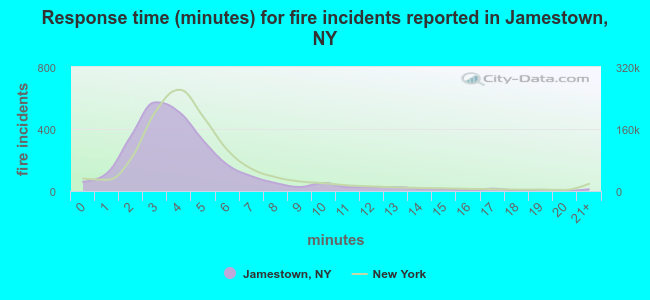 The median response time based on all reported fire incidents is 4 minutes. This is comparable to the state median value.
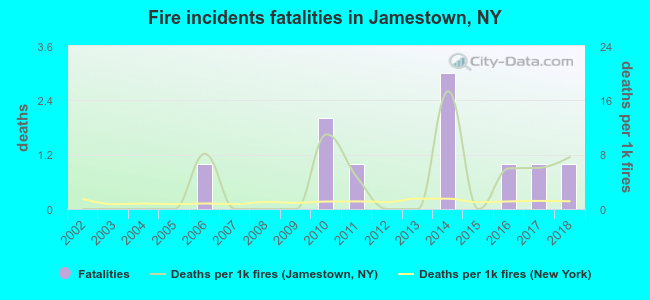 Based on the reports from the years 2002 - 2018 the average number of fire-related fatalities per year is 1. The highest number of reported deaths - 3 took place in 2014, and the lowest - 0 in 2002. The data has a rising trend.
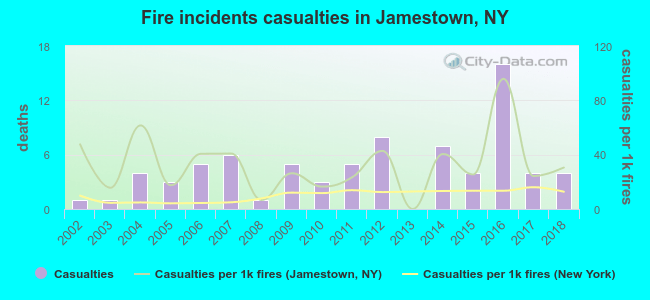 According to the data from the years 2002 - 2018 the average number of fire-related casualties per year is 5. The highest number of injuries - 16 took place in 2016, and the lowest - 0 in 2013. The data has a rising trend.
The average number of injuries per 1,000 fires is 33. This indicator was the highest - 96 in 2016, and the lowest 0 in 2013. The trend for injuries per 1,000 fire incidents is declining. Compared to the New York value the number of injuries per 1,000 incidents is much higher.
According to the data from the years 2002 - 2018 the average number of fire-related casualties per year is 5. The highest number of injuries - 16 took place in 2016, and the lowest - 0 in 2013. The data has a rising trend.
The average number of injuries per 1,000 fires is 33. This indicator was the highest - 96 in 2016, and the lowest 0 in 2013. The trend for injuries per 1,000 fire incidents is declining. Compared to the New York value the number of injuries per 1,000 incidents is much higher.
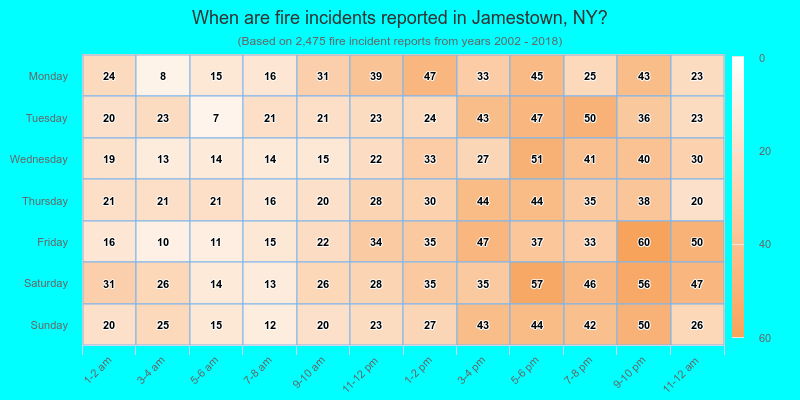
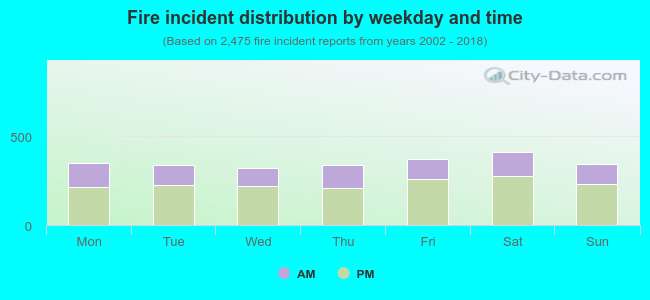 33.7% incidents where reported in the morning and 66.3% in the evening. The most fires (16.7%) took place on Saturday, and the least (12.9%) on Wednesday.
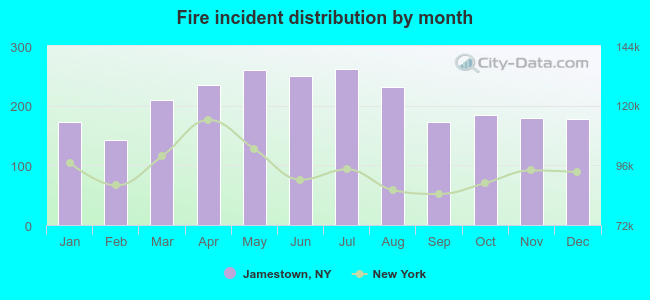 Based on the 2,475 fire incidents from years 2002 - 2018 most fires (10.6%) took place during July, and the least (5.7%) in February.
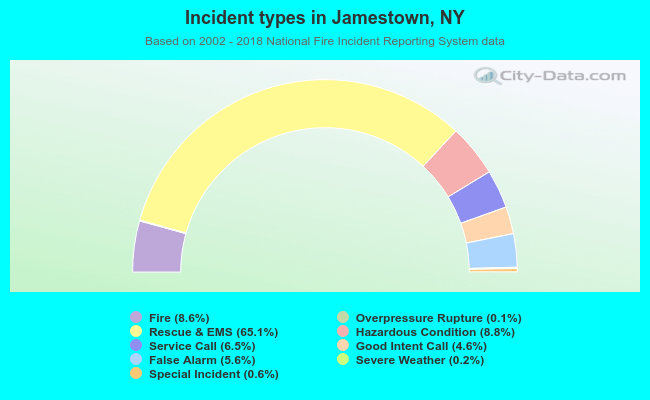 Out of all 28,845 cases reported during the years 2002 - 2018, the most belonged to the categories: Rescue & EMS (65.1%), Hazardous Condition (8.8%), and Fire (8.6%).
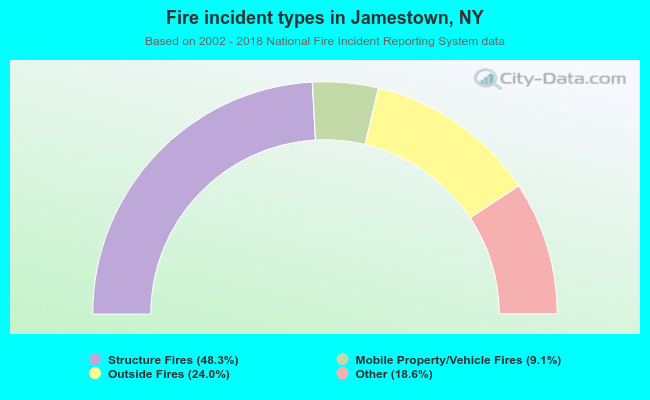 When looking into fire subcategories, the most incidents belonged to: Structure Fires (48.3%), and Outside Fires (24.0%).