Jackson: Fire Incidents, Missouri (MO)
Where are fire incidents reported in Jackson, MO
Something went wrong! Please refresh the page.
| Fire incidents reported | |
|---|---|
| Sreet name | Count |
| JACKSON BLVD | 160 |
| MAIN ST | 76 |
| OLD CAPE RD | 64 |
| HIGH ST | 62 |
| HOPE ST | 58 |
| INTERSTATE 55 | 56 |
| GREENSFERRY RD | 42 |
| FARMINGTON RD | 38 |
| WASHINGTON ST | 36 |
| LEE AVE | 32 |
| ST HWY Y | 32 |
| BAINBRIDGE RD | 30 |
| SHAWNEE BLVD | 30 |
| INDEPENDENCE ST | 28 |
| ADAMS ST | 26 |
| OAK ST | 24 |
| OLD TOLL RD | 22 |
| US HWY 61 | 22 |
| JEFFERSON ST | 18 |
| BELLEVUE ST | 16 |
| BROADRIDGE DR | 16 |
| I-55 | 16 |
| MARY ST | 16 |
| HIGHLAND DR | 14 |
| OHIO ST | 14 |
| OLD CAPE ROAD | 14 |
| RIDGE RD | 14 |
| UNION AVE | 14 |
| BELLA VISTA | 12 |
| CR 525 | 12 |
| Other | 429 |
2002 - 2018 National Fire Incident Reporting System (NFIRS) incidents
- Incident types reported to NFIRS in Jackson, MO
- 4,59144.0%Rescue & EMS
- 2,51724.1%Hazardous Condition
- 1,44313.8%Fire
- 7767.4%Service Call
- 6456.2%Good Intent Call
- 4204.0%False Alarm
- 110.1%Severe Weather
- Fire incident types reported to NFIRS in Jackson, MO
- 59040.9%Structure Fires
- 53937.4%Outside Fires
- 24216.8%Mobile Property/Vehicle Fires
- 725.0%Other
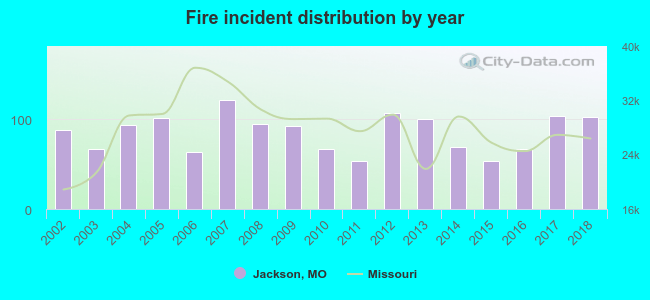 Based on the data from the years 2002 - 2018 the average number of fires per year is 85. The highest number of reported fires - 121 took place in 2007, and the least - 53 in 2011. The data has a rising trend.
The average number of yearly fire incidents per 10k residents in Jackson, MO compared to nearest cities:
(Note: Based on data for the last 3 years, including only cities with population 5,000 and above)
| Jackson: | 61.8 |
| Cape Girardeau: | 34.3 |
| Perryville: | 31.0 |
| Sikeston: | 104.9 |
| Charleston: | 9.6 |
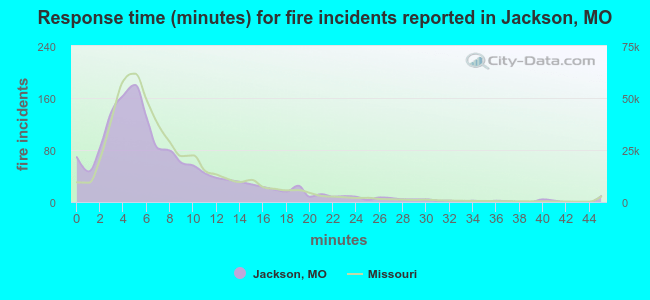 The median response time based on all reported fire incidents is 6 minutes. This is close to the state median value.
The median response time in Jackson, MO compared to nearest cities:
(Note: Based on data for all years, including only cities with at least 500 fire incidents)
| Jackson: | 6 minutes |
| Cape Girardeau: | 4 minutes |
| Anna: | 5 minutes |
| Perryville: | 10 minutes |
| Murphysboro: | 5 minutes |
| Carbondale: | 4 minutes |
| Sikeston: | 5 minutes |
| Cairo: | 3 minutes |
| Fredericktown: | 11 minutes |
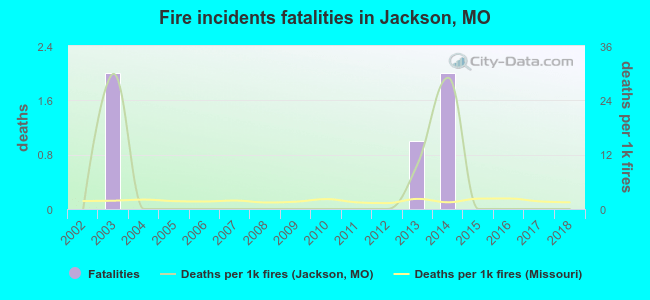 Based on the reports from the years 2002 - 2018 the average number of fire-related yearly deaths is 0. The highest number of deaths - 2 took place in 2003, and the lowest - 0 in 2002. The data has a constant trend.
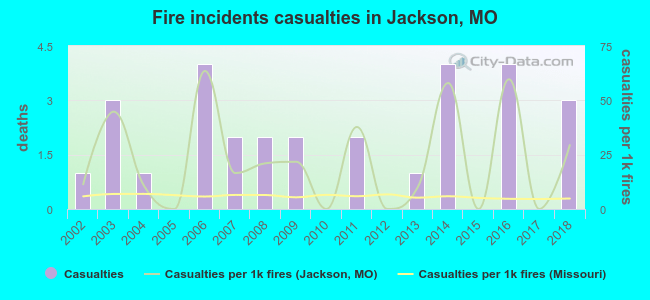 According to the reports from the years 2002 - 2018 the average number of fire-related yearly casualties is 2. The highest number of injuries - 4 took place in 2006, and the lowest - 0 in 2005. The data has a growing trend.
The average number of casualties per 1,000 fires is 23. This indicator was the highest - 63 in 2006, and the lowest 0 in 2005. The trend for injuries per 1,000 fire incidents is rising. Compared to the state value the number of casualties per 1,000 fire incidents is much higher.
According to the reports from the years 2002 - 2018 the average number of fire-related yearly casualties is 2. The highest number of injuries - 4 took place in 2006, and the lowest - 0 in 2005. The data has a growing trend.
The average number of casualties per 1,000 fires is 23. This indicator was the highest - 63 in 2006, and the lowest 0 in 2005. The trend for injuries per 1,000 fire incidents is rising. Compared to the state value the number of casualties per 1,000 fire incidents is much higher.Casualties per 1,000 incidents in Jackson, MO compared to nearest cities:
(Note: Based on data for all years, including only cities with at least 500 fire incidents)
| Jackson: | 20.1 |
| Cape Girardeau: | 5.6 |
| Anna: | 3.6 |
| Perryville: | 0.0 |
| Murphysboro: | 15.5 |
| Carbondale: | 24.0 |
| Sikeston: | 11.2 |
| Cairo: | 0.0 |
| Fredericktown: | 5.7 |
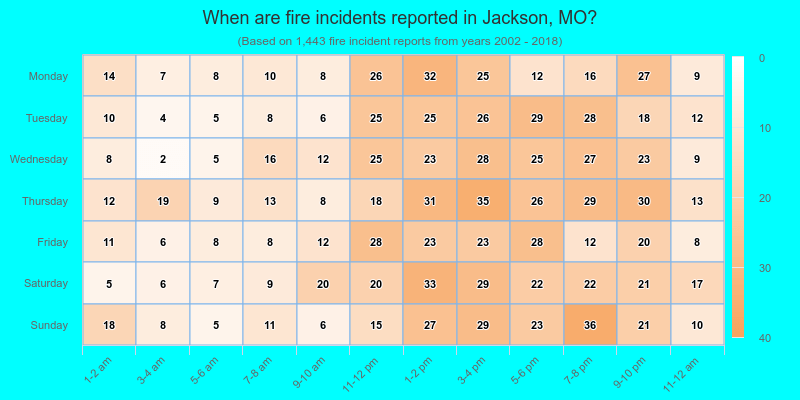
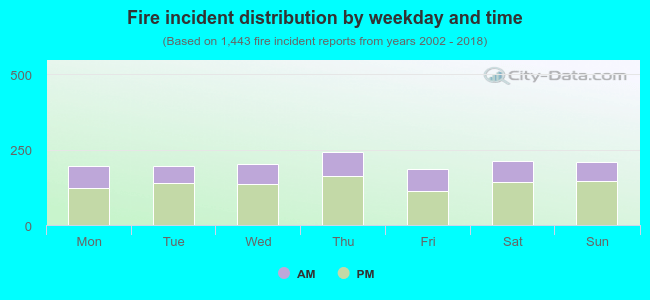 33.3% incidents where reported in the morning and 66.7% in the evening. The most fires (16.8%) took place on Thursday, and the least (13.0%) on Friday.
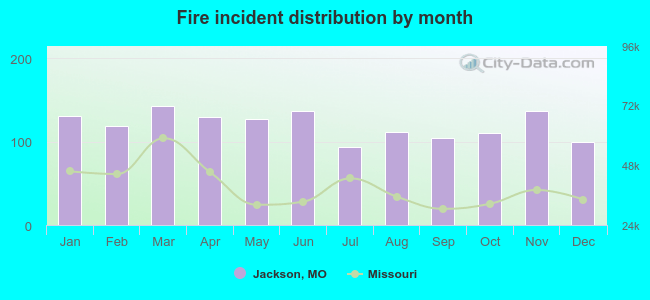 Based on the 1,443 reports from years 2002 - 2018 most fires (9.9%) took place during March, and the least (6.4%) in July.
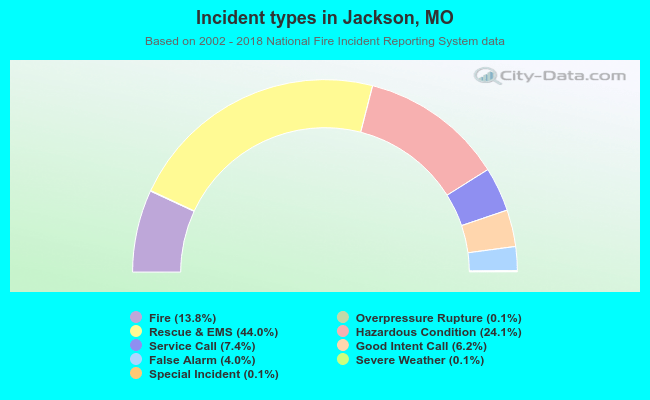 Out of all 10,423 cases reported during the years 2002 - 2018, the most belonged to the categories: Rescue & EMS (44.0%), Hazardous Condition (24.1%), and Fire (13.8%).
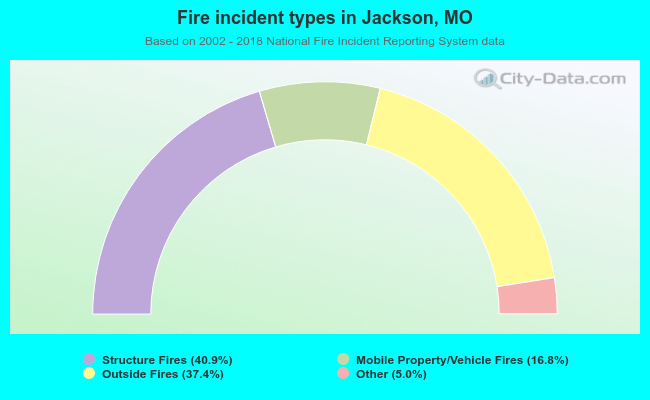 When looking into fire subcategories, the most reports belonged to: Structure Fires (40.9%), and Outside Fires (37.4%).