Irondequoit: Fire Incidents, New York (NY)
Where are fire incidents reported in Irondequoit, NY
Something went wrong! Please refresh the page.
|
| |||||||||||||||||||||||||||||||||||||||||||||||||||||||||||||||||||||||||||||||||||||||||||||||||||||||||||||
2012 - 2018 National Fire Incident Reporting System (NFIRS) incidents
- Incident types reported to NFIRS in Irondequoit, NY
- 3,18952.2%Rescue & EMS
- 72911.9%Service Call
- 66210.8%Hazardous Condition
- 64110.5%False Alarm
- 5108.4%Good Intent Call
- 3045.0%Fire
- 420.7%Severe Weather
- 160.3%Overpressure Rupture
- 110.2%Special Incident
- Fire incident types reported to NFIRS in Irondequoit, NY
- 17457.2%Structure Fires
- 9531.3%Outside Fires
- 227.2%Mobile Property/Vehicle Fires
- 134.3%Other
 According to the data from the years 2012 - 2018 the average number of fire incidents per year is 43. The highest number of fires - 67 took place in 2016, and the least - 12 in 2012. The data has a rising trend.
The average number of yearly fire incidents per 10k residents in Irondequoit, NY compared to nearest cities:
(Note: Based on data for the last 3 years, including only cities with population 5,000 and above)
| Irondequoit: | 10.0 |
| Rochester: | 93.1 |
| Brighton: | 1.6 |
| Greece: | 81.3 |
| Penfield: | 21.2 |
| Webster: | 200.8 |
| Gates: | 2.6 |
| East Rochester: | 31.3 |
| Fairport: | 126.0 |
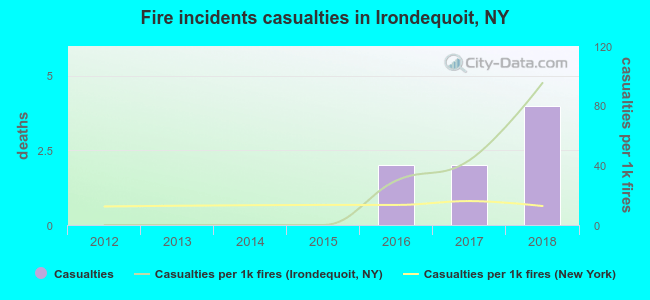 Based on the reports from the years 2012 - 2018 the average number of fire-related yearly casualties is 1. The highest number of injuries - 4 took place in 2018, and the lowest - 0 in 2012. The data has an increasing trend.
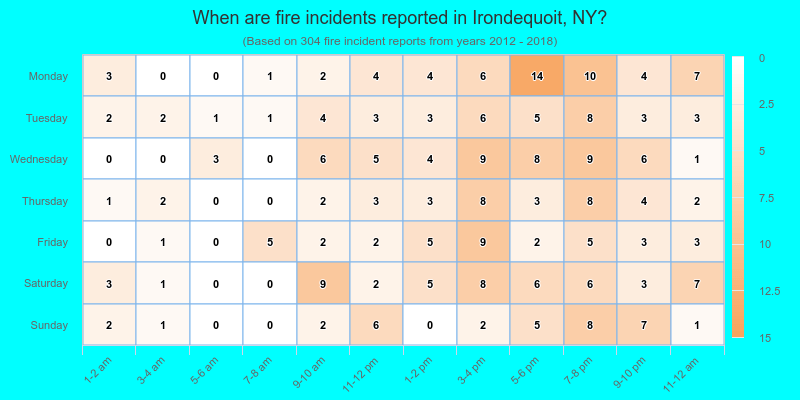
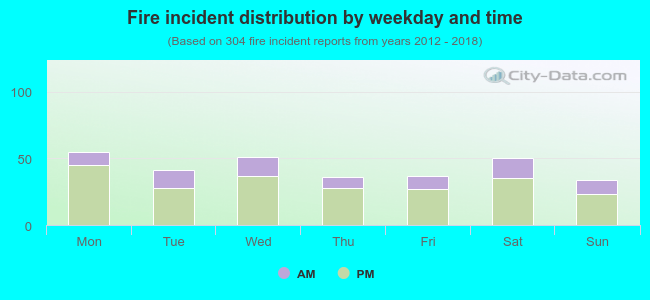 26.6% incidents where reported in the morning and 73.4% in the evening. The most fires (18.1%) took place on Monday, and the least (11.2%) on Sunday.
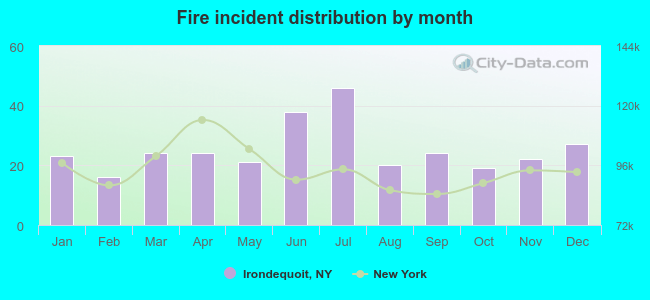 According to the 304 fire incidents from years 2012 - 2018 most fires (15.1%) took place during July, and the least (5.3%) in February.
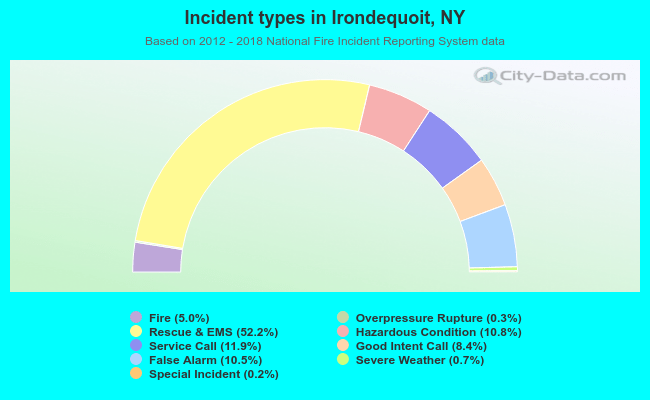 Out of all 6,104 cases reported during the years 2012 - 2018, the most belonged to the categories: Rescue & EMS (52.2%), Service Call (11.9%), and Hazardous Condition (10.8%).
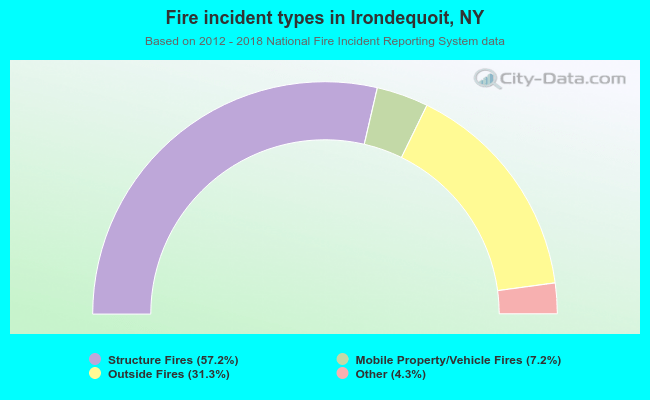 When looking into fire subcategories, the most incidents belonged to: Structure Fires (57.2%), and Outside Fires (31.3%).