Indiantown: Fire Incidents, Florida (FL)
Where are fire incidents reported in Indiantown, FL
Something went wrong! Please refresh the page.
|
| |||||||||||||||||||||||||||||||||||||||||||||||||||||||||||||||||||||||||||||||||||||||||||||||||||||||||||||
2005 - 2018 National Fire Incident Reporting System (NFIRS) incidents
- Incident types reported to NFIRS in Indiantown, FL
- 3,47061.3%Rescue & EMS
- 1,02218.0%Service Call
- 4748.4%Fire
- 3896.9%Good Intent Call
- 1853.3%Hazardous Condition
- 1172.1%False Alarm
- Fire incident types reported to NFIRS in Indiantown, FL
- 32869.2%Outside Fires
- 8417.7%Mobile Property/Vehicle Fires
- 6012.7%Structure Fires
- 20.4%Other
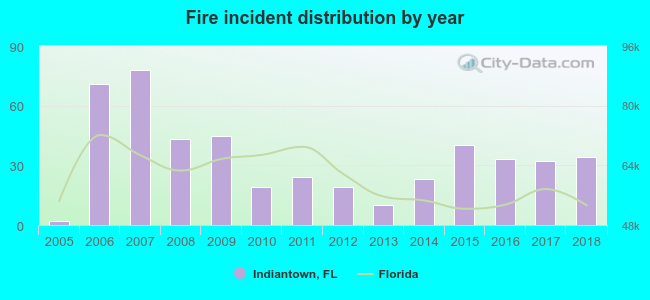 Based on the data from the years 2005 - 2018 the average number of fire incidents per year is 34. The highest number of reported fires - 78 took place in 2007, and the least - 2 in 2005. The data has a growing trend.
The average number of yearly fire incidents per 10k residents in Indiantown, FL compared to nearest cities:
(Note: Based on data for the last 3 years, including only cities with population 5,000 and above)
| Indiantown: | 54.2 |
| Palm City: | 21.5 |
| Pahokee: | 36.5 |
| Stuart: | 46.7 |
| Port Salerno: | 1.0 |
| Hobe Sound: | 18.7 |
| Jensen Beach: | 27.0 |
| Glades: | 0.5 |
| Tequesta: | 21.0 |

 Based on the reports from the years 2005 - 2018 the average number of fire-related casualties per year is 1. The highest number of casualties - 6 took place in 2018, and the lowest - 0 in 2005. The data has a rising trend.
 27.8% incidents where reported in the morning and 72.2% in the evening. The most fires (18.1%) took place on Saturday, and the least (11.2%) on Friday.
 Based on the 474 fire incident reports from years 2005 - 2018 most fires (15.2%) took place during May, and the least (4.0%) in October.
 Out of all 5,665 cases reported during the years 2005 - 2018, the most belonged to the categories: Rescue & EMS (61.3%), Service Call (18.0%), and Fire (8.4%).
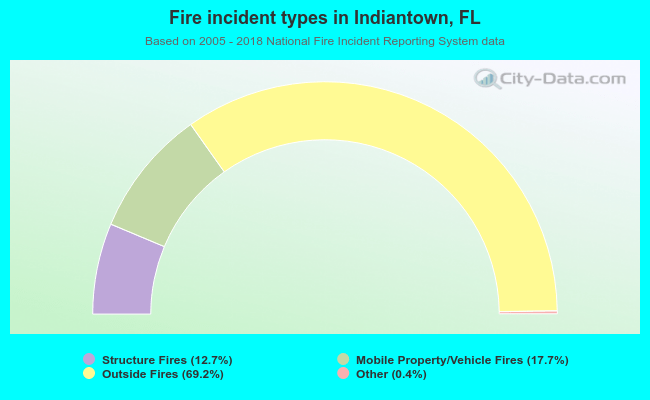 When looking into fire subcategories, the most incidents belonged to: Outside Fires (69.2%), and Mobile Property/Vehicle Fires (17.7%).