Idabel: Fire Incidents, Oklahoma (OK)
Where are fire incidents reported in Idabel, OK
Something went wrong! Please refresh the page.
| Fire incidents reported | |
|---|---|
| Sreet name | Count |
| HWY 3 EAST | 166 |
| HWY 37 WEST | 144 |
| HWY 259 SOUTH | 102 |
| SOUTH SEMINOLE | 60 |
| HWY 259 NORTH | 58 |
| HWY 70 WEST | 44 |
| SOUTH LYNN LANE | 40 |
| HWY 70 BYPASS | 20 |
| LYNN LANE | 20 |
| OLD HWY 21 | 16 |
| NORTH CENTRAL | 14 |
| 259 SOUTH | 12 |
| CANFIELD RD | 12 |
| SE LINCOLN RD | 12 |
| SW VAN BUREN | 12 |
| BOSS RD. | 10 |
| RIFLE RANGE ROAD | 10 |
| SW LINCOLN RD | 10 |
| 1803 NW SEMINOLE | 8 |
| 259 NORTH | 8 |
| 901 SW VAN BUREN | 8 |
| BROWN ADDITION | 8 |
| EAST LINCOLN RD | 8 |
| LEEGATES ROAD | 8 |
| LIVINGLAND RD | 8 |
| NE 4TH | 8 |
| NORTH SEMINOLE | 8 |
| NW LINCOLN RD | 8 |
| S LYNN LANE | 8 |
| SE AVE J | 8 |
| Other | 886 |
2003 - 2018 National Fire Incident Reporting System (NFIRS) incidents
- Incident types reported to NFIRS in Idabel, OK
- 1,74443.0%Fire
- 1,31532.4%Service Call
- 46711.5%Rescue & EMS
- 2165.3%Good Intent Call
- 2155.3%Hazardous Condition
- 761.9%False Alarm
- 90.2%Special Incident
- 70.2%Severe Weather
- 50.1%Overpressure Rupture
- Fire incident types reported to NFIRS in Idabel, OK
- 1,11363.8%Outside Fires
- 41523.8%Structure Fires
- 1609.2%Mobile Property/Vehicle Fires
- 563.2%Other
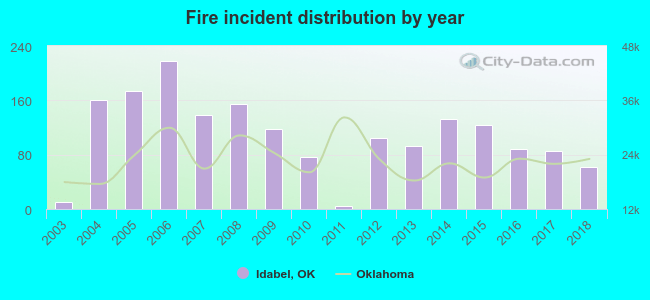 Based on the data from the years 2003 - 2018 the average number of fires per year is 109. The highest number of fire incidents - 218 took place in 2006, and the least - 4 in 2011. The data has a rising trend.
The average number of yearly fire incidents per 10k residents in Idabel, OK compared to nearest cities:
(Note: Based on data for the last 3 years, including only cities with population 5,000 and above)
| Idabel: | 112.2 |
| Hugo: | 240.8 |
 The median response time based on all reported fire incidents is 5 minutes. This is lower than the state median value.
The median response time in Idabel, OK compared to nearest cities:
(Note: Based on data for all years, including only cities with at least 500 fire incidents)
| Idabel: | 5 minutes |
| Broken Bow: | 7 minutes |
| Hugo: | 5 minutes |
| Ashdown: | 7 minutes |
| Antlers: | 8 minutes |
 26.7% incidents where reported in the morning and 73.3% in the evening. The most fires (15.4%) took place on Thursday, and the least (13.1%) on Wednesday.
 Based on the 1,744 fire incidents from years 2003 - 2018 most fires (12.3%) took place during February, and the least (5.4%) in May.
 Out of all 4,054 cases reported during the years 2003 - 2018, the most belonged to the categories: Fire (43.0%), Service Call (32.4%), and Rescue & EMS (11.5%).
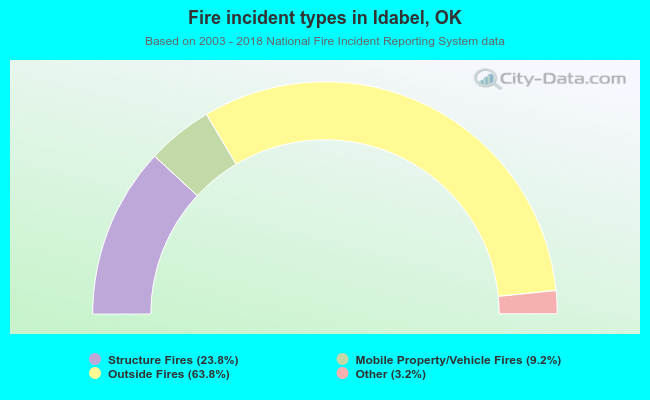 When looking into fire subcategories, the most reports belonged to: Outside Fires (63.8%), and Structure Fires (23.8%).