Holly Springs: Fire Incidents, North Carolina (NC)
Where are fire incidents reported in Holly Springs, NC
Something went wrong! Please refresh the page.
| Fire incidents reported | |
|---|---|
| Sreet name | Count |
| HOLLY SPRINGS RD | 76 |
| SUNSET LAKE RD | 60 |
| MAIN ST | 54 |
| NC 42 | 54 |
| BASS LAKE RD | 50 |
| AVENT FERRY RD | 46 |
| CASS HOLT RD | 44 |
| G B ALFORD HWY | 38 |
| OLD SMITHFIELD RD | 22 |
| VINE ST | 22 |
| GB ALFORD HWY | 20 |
| GRAND HILL PL | 18 |
| ADCOCK RD | 16 |
| PINEY GROVE-WILBON RD | 16 |
| ROUSE RD | 16 |
| SPENCE FARM RD | 16 |
| REX RD | 14 |
| BALLENTINE ST | 12 |
| FIREFLY RD | 12 |
| GOOSEBERRY DR | 12 |
| HOLLY MEADOW DR | 12 |
| MIMS RD | 12 |
| NEW HILL HOLLEMAN RD | 12 |
| ROLLINS MILL RD | 12 |
| STARKLAND WAY | 12 |
| VILLAGE WALK DR | 12 |
| WADE STEPHENSON RD | 12 |
| BALL RD | 10 |
| BUCKHORN DUNCAN RD | 10 |
| CAYMAN AVE | 10 |
| Other | 451 |
2002 - 2018 National Fire Incident Reporting System (NFIRS) incidents
- Incident types reported to NFIRS in Holly Springs, NC
- 3,28940.5%Rescue & EMS
- 1,23015.1%Good Intent Call
- 1,18314.6%Fire
- 96711.9%False Alarm
- 85610.5%Hazardous Condition
- 5456.7%Service Call
- 340.4%Severe Weather
- 120.1%Special Incident
- 90.1%Overpressure Rupture
- Fire incident types reported to NFIRS in Holly Springs, NC
- 59950.6%Structure Fires
- 44237.4%Outside Fires
- 11810.0%Mobile Property/Vehicle Fires
- 242.0%Other
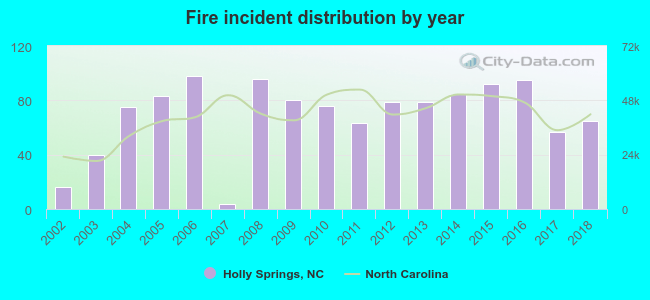 According to the data from the years 2002 - 2018 the average number of fire incidents per year is 70. The highest number of reported fire incidents - 98 took place in 2006, and the least - 4 in 2007. The data has an increasing trend.
The average number of yearly fire incidents per 10k residents in Holly Springs, NC compared to nearest cities:
(Note: Based on data for the last 3 years, including only cities with population 5,000 and above)
| Holly Springs: | 24.0 |
| Apex: | 26.2 |
| Cary: | 16.8 |
| Garner: | 53.3 |
| Morrisville: | 25.0 |
| Raleigh: | 24.8 |
| Clayton: | 129.0 |
| Knightdale: | 119.9 |
| Chapel Hill: | 39.1 |
 The median response time based on all reported fire incidents is 6 minutes. This is close to the North Carolina median value.
The median response time in Holly Springs, NC compared to nearest cities:
(Note: Based on data for all years, including only cities with at least 500 fire incidents)
| Holly Springs: | 6 minutes |
| Fuquay-Varina: | 5 minutes |
| Apex: | 6 minutes |
| Cary: | 5 minutes |
| Angier: | 9 minutes |
| Garner: | 5 minutes |
| Morrisville: | 6 minutes |
| Raleigh: | 5 minutes |
| Lillington: | 9 minutes |
 According to the reports from the years 2002 - 2018 the average number of fire-related casualties per year is 0. The highest number of reported casualties - 1 took place in 2005, and the lowest - 0 in 2002. The data has a growing trend.
The average number of casualties per 1,000 fires is 3. This indicator was the highest - 18 in 2017, and the lowest 0 in 2002. The trend for casualties per 1,000 incidents is rising. Compared to the state value the number of casualties per 1,000 fires is much lower.
According to the reports from the years 2002 - 2018 the average number of fire-related casualties per year is 0. The highest number of reported casualties - 1 took place in 2005, and the lowest - 0 in 2002. The data has a growing trend.
The average number of casualties per 1,000 fires is 3. This indicator was the highest - 18 in 2017, and the lowest 0 in 2002. The trend for casualties per 1,000 incidents is rising. Compared to the state value the number of casualties per 1,000 fires is much lower.Casualties per 1,000 incidents in Holly Springs, NC compared to nearest cities:
(Note: Based on data for all years, including only cities with at least 500 fire incidents)
| Holly Springs: | 2.5 |
| Fuquay-Varina: | 2.7 |
| Apex: | 6.6 |
| Cary: | 12.2 |
| Angier: | 1.1 |
| Garner: | 2.4 |
| Morrisville: | 6.8 |
| Raleigh: | 7.0 |
| Lillington: | 2.7 |
 24.8% incidents where reported in the morning and 75.2% in the evening. The most fires (16.6%) took place on Sunday, and the least (11.1%) on Tuesday.
 According to the 1,183 incident reports from years 2002 - 2018 most fires (11.6%) took place during July, and the least (5.2%) in August.
 Out of all 8,125 cases reported during the years 2002 - 2018, the most belonged to the categories: Rescue & EMS (40.5%), Good Intent Call (15.1%), and Fire (14.6%).
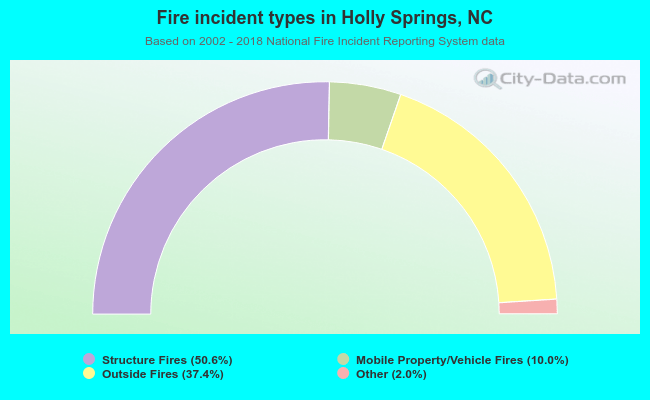 When looking into fire subcategories, the most incidents belonged to: Structure Fires (50.6%), and Outside Fires (37.4%).