Hazleton: Fire Incidents, Pennsylvania (PA)
Where are fire incidents reported in Hazleton, PA
Something went wrong! Please refresh the page.
| Fire incidents reported | |
|---|---|
| Sreet name | Count |
| MINE ST | 338 |
| BROAD ST | 170 |
| DIAMOND AVE | 116 |
| CHURCH ST | 114 |
| PINE ST | 88 |
| ALTER ST | 76 |
| VINE ST | 76 |
| WYOMING ST | 74 |
| LAUREL ST | 56 |
| GRANT ST | 52 |
| LOCUST ST | 48 |
| JAMES ST | 36 |
| PEACE ST | 34 |
| GREEN ST | 32 |
| CEDAR ST | 28 |
| JUNIPER ST | 28 |
| CARSON ST | 26 |
| GARFIELD ST | 26 |
| LINCOLN ST | 26 |
| ARTHUR ST | 22 |
| HAYES ST | 20 |
| MCKINLEY ST | 20 |
| SEYBERT ST | 20 |
| CARLETON AVE | 18 |
| MAPLE ST | 18 |
| WILSON DR | 18 |
| POPLAR ST | 16 |
| 3RD ST | 14 |
| CHESTNUT ST | 14 |
| PENN CT | 14 |
2005 - 2018 National Fire Incident Reporting System (NFIRS) incidents
- Incident types reported to NFIRS in Hazleton, PA
- 2,26332.6%Hazardous Condition
- 1,86226.8%Rescue & EMS
- 1,26718.3%Fire
- 6449.3%Service Call
- 5568.0%False Alarm
- 3154.5%Good Intent Call
- 180.3%Overpressure Rupture
- 100.1%Special Incident
- Fire incident types reported to NFIRS in Hazleton, PA
- 85267.2%Structure Fires
- 23518.5%Outside Fires
- 14911.8%Mobile Property/Vehicle Fires
- 312.4%Other
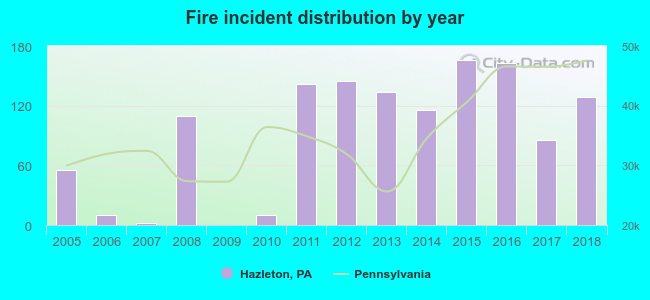 Based on the data from the years 2005 - 2018 the average number of fires per year is 91. The highest number of fire incidents - 166 took place in 2015, and the least - 0 in 2009. The data has a growing trend.
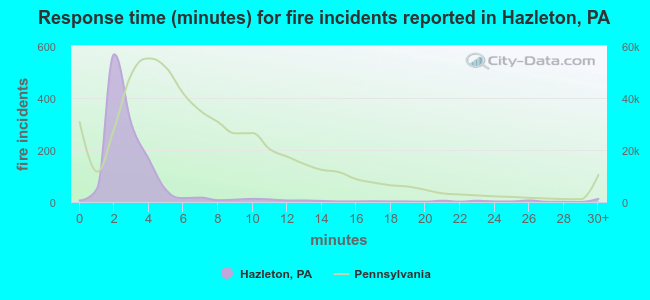 The median response time based on all reported fire incidents is 3 minutes. This is much lower than the state median value.
The median response time in Hazleton, PA compared to nearest cities:
(Note: Based on data for all years, including only cities with at least 500 fire incidents)
| Hazleton: | 3 minutes |
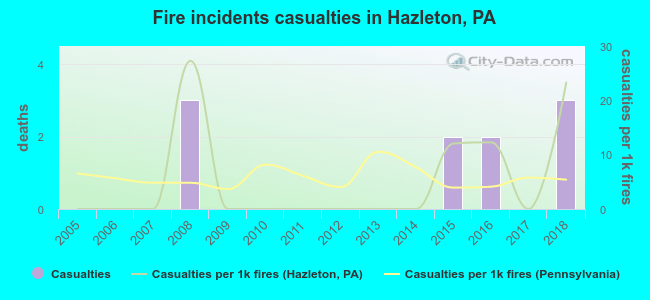 Based on the data from the years 2005 - 2018 the average number of fire-related yearly casualties is 1. The highest number of reported injuries - 3 took place in 2008, and the lowest - 0 in 2005. The data has a rising trend.
The average number of injuries per 1,000 fires is 5. This indicator was the highest - 27 in 2008, and the lowest 0 in 2005. The trend for injuries per 1,000 incidents is increasing. Compared to the Pennsylvania value the number of casualties per 1,000 incidents is higher.
Based on the data from the years 2005 - 2018 the average number of fire-related yearly casualties is 1. The highest number of reported injuries - 3 took place in 2008, and the lowest - 0 in 2005. The data has a rising trend.
The average number of injuries per 1,000 fires is 5. This indicator was the highest - 27 in 2008, and the lowest 0 in 2005. The trend for injuries per 1,000 incidents is increasing. Compared to the Pennsylvania value the number of casualties per 1,000 incidents is higher.Casualties per 1,000 incidents in Hazleton, PA compared to nearest cities:
(Note: Based on data for all years, including only cities with at least 500 fire incidents)
| Hazleton: | 7.9 |
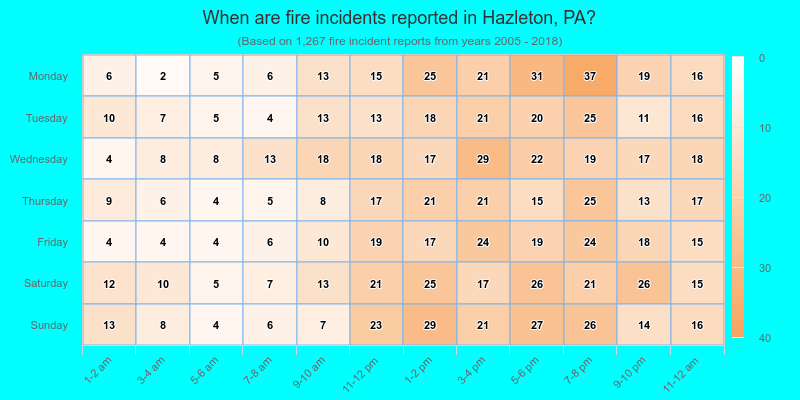
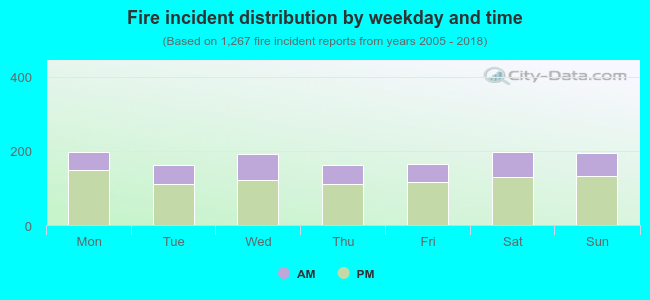 31.0% incidents where reported in the morning and 69.0% in the evening. The most fires (15.6%) took place on Saturday, and the least (12.7%) on Thursday.
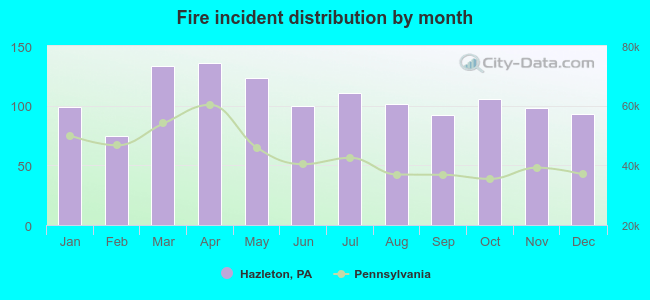 According to the 1,267 fire incidents from years 2005 - 2018 most fires (10.7%) took place during April, and the least (5.9%) in February.
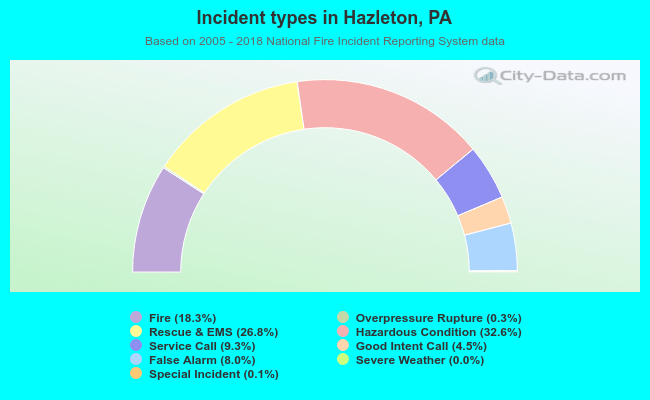 Out of all 6,937 cases reported during the years 2005 - 2018, the most belonged to the categories: Hazardous Condition (32.6%), Rescue & EMS (26.8%), and Fire (18.3%).
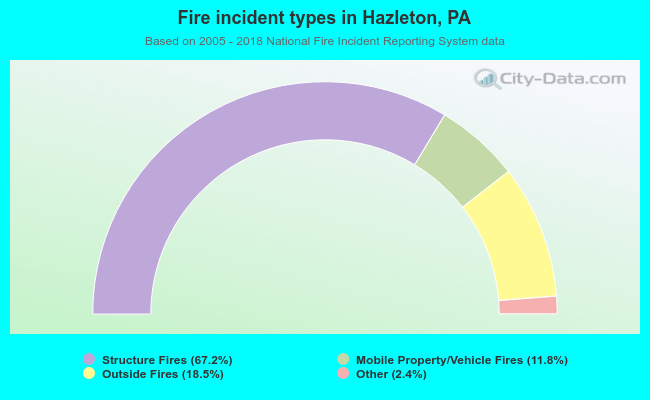 When looking into fire subcategories, the most incidents belonged to: Structure Fires (67.2%), and Outside Fires (18.5%).