Harrison: Fire Incidents, Ohio (OH)
Where are fire incidents reported in Harrison, OH
Something went wrong! Please refresh the page.
| Fire incidents reported | |
|---|---|
| Sreet name | Count |
| HARRISON AVE | 164 |
| NEW HAVEN RD | 90 |
| DRY FORK RD | 54 |
| LAWRENCEBURG RD | 48 |
| I-74 HWY | 46 |
| LYNESS AVE | 46 |
| WEST RD | 44 |
| CAROLINA TRACE RD | 42 |
| FLORA RD | 38 |
| CAMPBELL RD | 36 |
| LAWRENCEBURG RD | 34 |
| RIVER RD | 32 |
| STATE ST | 32 |
| EDGEWOOD RD | 30 |
| NEW BIDDINGER RD | 30 |
| KILBY RD | 28 |
| WHITEWATER DR | 28 |
| GEORGE ST | 24 |
| PARK AVE | 24 |
| STATE ROUTE 128 | 22 |
| BOND RD | 20 |
| BROOKS RD | 20 |
| STONE DR | 20 |
| BAUGHMAN RD | 18 |
| BROADWAY ST | 18 |
| SYCAMORE ST | 18 |
| BROOKS RD | 16 |
| DAIR AVE | 16 |
| DICK RD | 16 |
| HAMILTON CLEVES HIGHWAY | 16 |
| Other | 186 |
2002 - 2018 National Fire Incident Reporting System (NFIRS) incidents
- Incident types reported to NFIRS in Harrison, OH
- 5,61056.4%Rescue & EMS
- 1,25612.6%Fire
- 1,24412.5%Hazardous Condition
- 7797.8%Good Intent Call
- 6876.9%False Alarm
- 3283.3%Service Call
- 230.2%Overpressure Rupture
- 150.2%Severe Weather
- 100.1%Special Incident
- Fire incident types reported to NFIRS in Harrison, OH
- 59247.1%Structure Fires
- 41633.1%Outside Fires
- 22918.2%Mobile Property/Vehicle Fires
- 191.5%Other
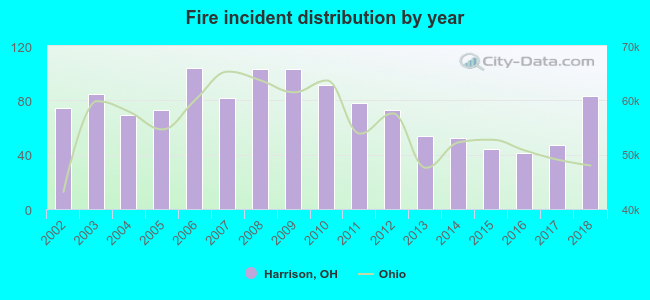 Based on the data from the years 2002 - 2018 the average number of fire incidents per year is 74. The highest number of reported fire incidents - 104 took place in 2006, and the least - 41 in 2016. The data has a growing trend.
The average number of yearly fire incidents per 10k residents in Harrison, OH compared to nearest cities:
(Note: Based on data for the last 3 years, including only cities with population 5,000 and above)
| Harrison: | 54.4 |
| Dent: | 1.0 |
| Bridgetown: | 1.7 |
| Cheviot: | 41.6 |
| North College Hill: | 23.5 |
| Mount Healthy: | 2.7 |
| Fairfield: | 23.7 |
| Forest Park: | 42.0 |
| Hamilton: | 65.6 |
 The median response time based on all reported fire incidents is 6 minutes. This is close to the Ohio median value.
The median response time in Harrison, OH compared to nearest cities:
(Note: Based on data for all years, including only cities with at least 500 fire incidents)
| Harrison: | 6 minutes |
| Cleves: | 7 minutes |
| Lawrenceburg: | 8 minutes |
| Cheviot: | 4 minutes |
| Hebron: | 6 minutes |
| Fairfield: | 5 minutes |
| Forest Park: | 5 minutes |
| Hamilton: | 5 minutes |
| Burlington: | 7 minutes |
 According to the data from the years 2002 - 2018 the average number of fire-related fatalities per year is 0. The highest number of reported deaths - 1 took place in 2007, and the lowest - 0 in 2002. The data has a constant trend.
 According to the reports from the years 2002 - 2018 the average number of fire-related yearly casualties is 1. The highest number of reported injuries - 3 took place in 2004, and the lowest - 0 in 2003. The data has a decreasing trend.
The average number of injuries per 1,000 fire incidents is 11. This indicator was the highest - 43 in 2004, and the lowest 0 in 2003. The trend for injuries per 1,000 incidents is declining. Compared to the state value the number of injuries per 1,000 fire incidents is lower.
According to the reports from the years 2002 - 2018 the average number of fire-related yearly casualties is 1. The highest number of reported injuries - 3 took place in 2004, and the lowest - 0 in 2003. The data has a decreasing trend.
The average number of injuries per 1,000 fire incidents is 11. This indicator was the highest - 43 in 2004, and the lowest 0 in 2003. The trend for injuries per 1,000 incidents is declining. Compared to the state value the number of injuries per 1,000 fire incidents is lower.Casualties per 1,000 incidents in Harrison, OH compared to nearest cities:
(Note: Based on data for all years, including only cities with at least 500 fire incidents)
| Harrison: | 11.1 |
| Cleves: | 14.0 |
| Lawrenceburg: | 2.8 |
| Cheviot: | 16.8 |
| Hebron: | 3.9 |
| Fairfield: | 10.8 |
| Forest Park: | 26.3 |
| Hamilton: | 10.6 |
| Burlington: | 14.4 |
 32.0% incidents where reported in the morning and 68.0% in the evening. The most fires (15.7%) took place on Monday, and the least (12.7%) on Thursday.
 Based on the 1,256 fire incidents from years 2002 - 2018 most fires (12.0%) took place during April, and the least (6.2%) in May.
 Out of all 9,952 cases reported during the years 2002 - 2018, the most belonged to the categories: Rescue & EMS (56.4%), Fire (12.6%), and Hazardous Condition (12.5%).
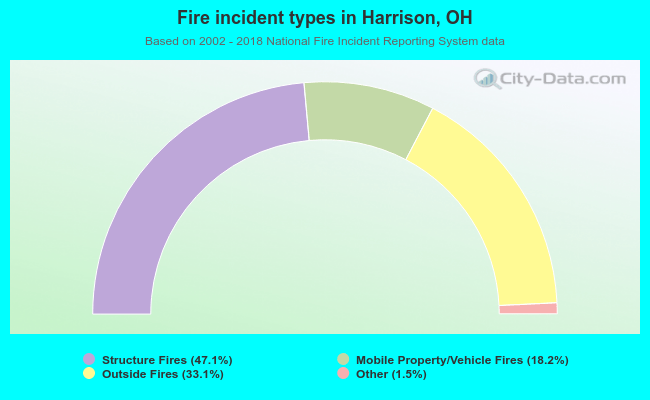 When looking into fire subcategories, the most incidents belonged to: Structure Fires (47.1%), and Outside Fires (33.1%).