Harrisburg: Fire Incidents, Pennsylvania (PA)
Where are fire incidents reported in Harrisburg, PA
Something went wrong! Please refresh the page.
| Fire incidents reported | |
|---|---|
| Sreet name | Count |
| DERRY ST | 642 |
| SIXTH ST | 594 |
| PAXTON ST | 498 |
| UNION DEPOSIT RD | 464 |
| WALNUT ST | 446 |
| JONESTOWN RD | 394 |
| MARKET ST | 386 |
| INTERSTATE 81 | 384 |
| FRONT ST | 380 |
| SECOND ST | 354 |
| THIRD ST | 340 |
| LINGLESTOWN RD | 316 |
| CHESTNUT ST | 310 |
| CHAMBERS HILL RD | 236 |
| THIRTEENTH ST | 234 |
| PROGRESS AVE | 210 |
| CAMERON ST | 202 |
| EISENHOWER BLVD | 180 |
| INTERSTATE 83 | 178 |
| GREEN ST | 174 |
| ALLENTOWN BLVD | 154 |
| FIFTEENTH ST | 154 |
| MOUNTAIN RD | 146 |
| EIGHTEENTH ST | 144 |
| FOURTH ST | 144 |
| PRESIDENTS DR | 138 |
| FIFTH ST | 132 |
| BOAS ST | 130 |
| CANBY ST | 124 |
| HALL MANOR | 124 |
| Other | 3,580 |
2005 - 2018 National Fire Incident Reporting System (NFIRS) incidents
- Incident types reported to NFIRS in Harrisburg, PA
- 11,89232.4%Fire
- 5,85616.0%Rescue & EMS
- 5,58815.2%Hazardous Condition
- 5,33514.6%Good Intent Call
- 5,21014.2%False Alarm
- 2,0955.7%Service Call
- 5671.5%Overpressure Rupture
- 710.2%Severe Weather
- 370.1%Special Incident
- Fire incident types reported to NFIRS in Harrisburg, PA
- 8,32470.0%Structure Fires
- 1,88915.9%Outside Fires
- 1,27710.7%Mobile Property/Vehicle Fires
- 4023.4%Other
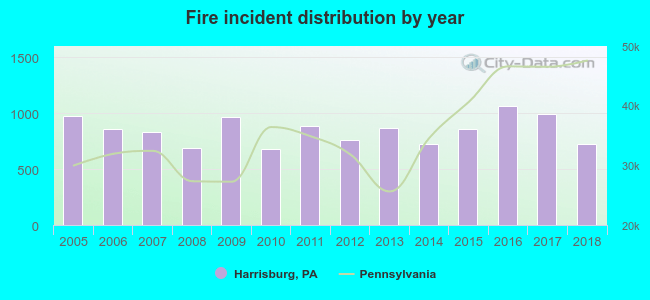 According to the data from the years 2005 - 2018 the average number of fire incidents per year is 849. The highest number of reported fire incidents - 1,067 took place in 2016, and the least - 679 in 2010. The data has a decreasing trend.
The average number of yearly fire incidents per 10k residents in Harrisburg, PA compared to nearest cities:
(Note: Based on data for the last 3 years, including only cities with population 5,000 and above)
| Harrisburg: | 188.7 |
| New Cumberland: | 60.1 |
| Camp Hill: | 137.3 |
| Enola: | 148.4 |
| Steelton: | 64.1 |
| Mechanicsburg: | 254.2 |
| Middletown: | 69.5 |
| Hershey: | 37.4 |
| Palmyra: | 69.9 |
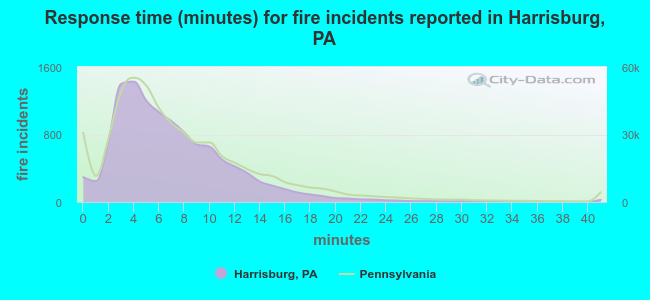 The median response time based on all reported fire incidents is 6 minutes. This is close to the state median value.
The median response time in Harrisburg, PA compared to nearest cities:
(Note: Based on data for all years, including only cities with at least 500 fire incidents)
| Harrisburg: | 6 minutes |
| New Cumberland: | 9 minutes |
| Camp Hill: | 8 minutes |
| Enola: | 8 minutes |
| Steelton: | 7 minutes |
| Dauphin: | 12 minutes |
| Mechanicsburg: | 9 minutes |
| Hummelstown: | 10 minutes |
| Middletown: | 9 minutes |
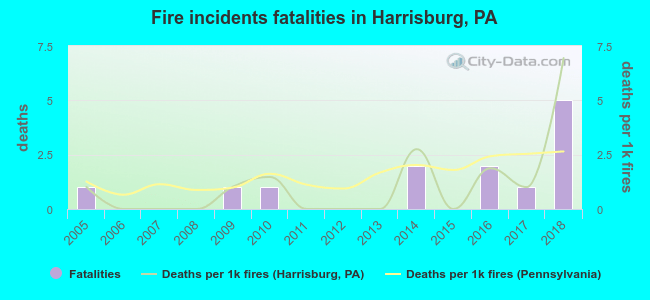 Based on the reports from the years 2005 - 2018 the average number of fire-related yearly deaths is 1. The highest number of reported deaths - 5 took place in 2018, and the lowest - 0 in 2006. The data has an increasing trend.
The average number of fatalities per 1,000 fires is 1. This indicator was the highest - 7 in 2018, and the lowest 0 in 2006. The trend for fatalities per 1,000 fire incidents is growing. Compared to the state value the number of fatalities per 1,000 fires is lower.
Based on the reports from the years 2005 - 2018 the average number of fire-related yearly deaths is 1. The highest number of reported deaths - 5 took place in 2018, and the lowest - 0 in 2006. The data has an increasing trend.
The average number of fatalities per 1,000 fires is 1. This indicator was the highest - 7 in 2018, and the lowest 0 in 2006. The trend for fatalities per 1,000 fire incidents is growing. Compared to the state value the number of fatalities per 1,000 fires is lower.Deaths per 1,000 incidents in Harrisburg, PA compared to nearest cities:
(Note: Based on data for all years, including only cities with at least 2,500 fire incidents)
| Harrisburg: | 1.1 |
| Mechanicsburg: | 0.3 |
| Carlisle: | 0.3 |
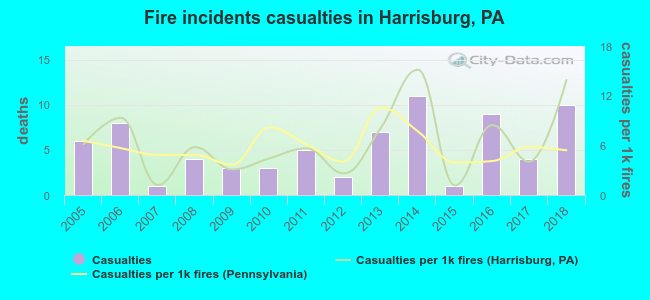 According to the data from the years 2005 - 2018 the average number of fire-related yearly casualties is 5. The highest number of casualties - 11 took place in 2014, and the lowest - 1 in 2007. The data has a growing trend.
The average number of injuries per 1,000 fires is 6. This indicator was the highest - 15 in 2014, and the lowest 1 in 2015. The trend for casualties per 1,000 incidents is increasing. Compared to the Pennsylvania value the number of casualties per 1,000 fires is similar.
According to the data from the years 2005 - 2018 the average number of fire-related yearly casualties is 5. The highest number of casualties - 11 took place in 2014, and the lowest - 1 in 2007. The data has a growing trend.
The average number of injuries per 1,000 fires is 6. This indicator was the highest - 15 in 2014, and the lowest 1 in 2015. The trend for casualties per 1,000 incidents is increasing. Compared to the Pennsylvania value the number of casualties per 1,000 fires is similar.Casualties per 1,000 incidents in Harrisburg, PA compared to nearest cities:
(Note: Based on data for all years, including only cities with at least 500 fire incidents)
| Harrisburg: | 6.2 |
| New Cumberland: | 1.3 |
| Camp Hill: | 2.0 |
| Enola: | 0.8 |
| Steelton: | 4.5 |
| Dauphin: | 0.0 |
| Mechanicsburg: | 1.4 |
| Hummelstown: | 7.1 |
| Middletown: | 0.0 |
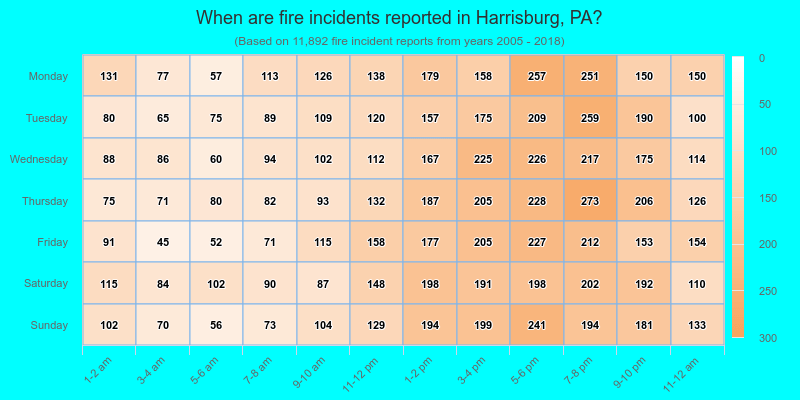
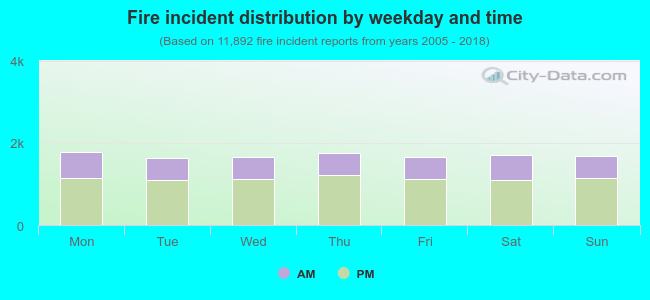 33.2% incidents where reported in the morning and 66.8% in the evening. The most fires (15.0%) took place on Monday, and the least (13.7%) on Tuesday.
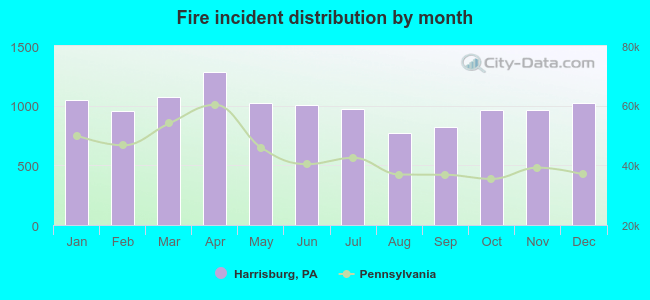 According to the 11,892 incident reports from years 2005 - 2018 most fires (10.8%) took place during April, and the least (6.5%) in August.
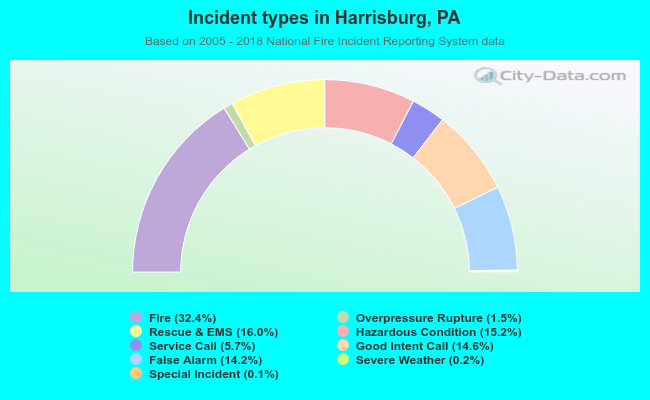 Out of all 36,651 cases reported during the years 2005 - 2018, the most belonged to the categories: Fire (32.4%), Rescue & EMS (16.0%), and Hazardous Condition (15.2%).
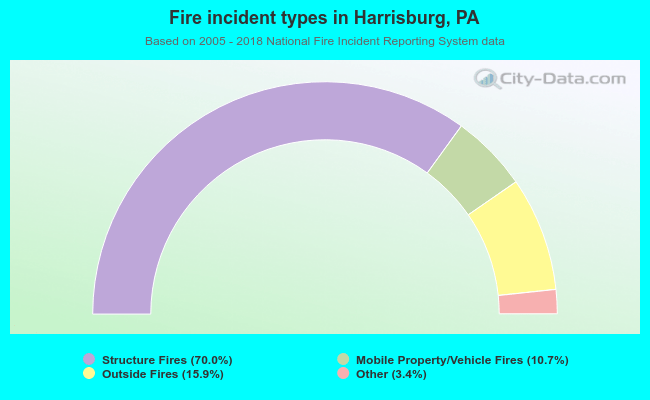 When looking into fire subcategories, the most reports belonged to: Structure Fires (70.0%), and Outside Fires (15.9%).