Hailey: Fire Incidents, Idaho (ID)
Where are fire incidents reported in Hailey, ID
Something went wrong! Please refresh the page.
|
| |||||||||||||||||||||||||||||||||||||||||||||||||||||||||||||||||||||||||||||||||||||||||||||||||||||||||||||
| Other | 1 | |||||||||||||||||||||||||||||||||||||||||||||||||||||||||||||||||||||||||||||||||||||||||||||||||||||||||||||
2002 - 2018 National Fire Incident Reporting System (NFIRS) incidents
- Incident types reported to NFIRS in Hailey, ID
- 3,92660.8%Rescue & EMS
- 76111.8%Fire
- 64910.1%Hazardous Condition
- 4497.0%Good Intent Call
- 3395.3%False Alarm
- 2764.3%Service Call
- 380.6%Special Incident
- 90.1%Overpressure Rupture
- 80.1%Severe Weather
- Fire incident types reported to NFIRS in Hailey, ID
- 31241.0%Outside Fires
- 29338.5%Structure Fires
- 8210.8%Other
- 749.7%Mobile Property/Vehicle Fires
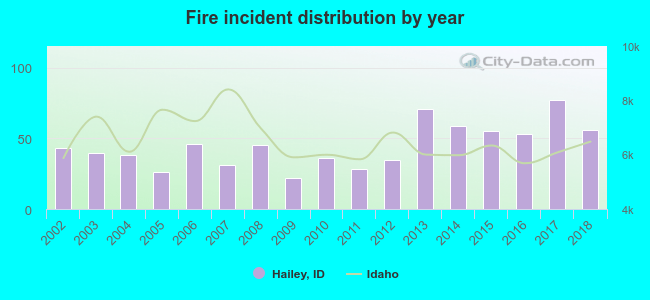 Based on the data from the years 2002 - 2018 the average number of fire incidents per year is 45. The highest number of reported fires - 77 took place in 2017, and the least - 22 in 2009. The data has an increasing trend.
The average number of yearly fire incidents per 10k residents in Hailey, ID compared to nearest cities:
(Note: Based on data for the last 3 years, including only cities with population 5,000 and above)
| Hailey: | 76.8 |
| Jerome: | 129.3 |
| Twin Falls: | 26.6 |
| Rupert: | 95.8 |
| Burley: | 83.7 |
| Mountain Home: | 46.9 |
| Moreland: | 1.0 |
| Boise: | 24.6 |
| Garden City: | 28.3 |
 The median response time based on all reported fire incidents is 6 minutes. This is close to the state median value.
The median response time in Hailey, ID compared to nearest cities:
(Note: Based on data for all years, including only cities with at least 500 fire incidents)
| Hailey: | 6 minutes |
| Gooding: | 10 minutes |
| Wendell: | 8 minutes |
| Jerome: | 7 minutes |
| Hagerman: | 11 minutes |
| Twin Falls: | 5 minutes |
| Filer: | 9 minutes |
| Buhl: | 8 minutes |
| Kimberly: | 9 minutes |
 27.5% incidents where reported in the morning and 72.5% in the evening. The most fires (18.0%) took place on Sunday, and the least (12.0%) on Friday.
 Based on the 761 fire incidents from years 2002 - 2018 most fires (19.8%) took place during July, and the least (3.5%) in November.
 Out of all 6,455 cases reported during the years 2002 - 2018, the most belonged to the categories: Rescue & EMS (60.8%), Fire (11.8%), and Hazardous Condition (10.1%).
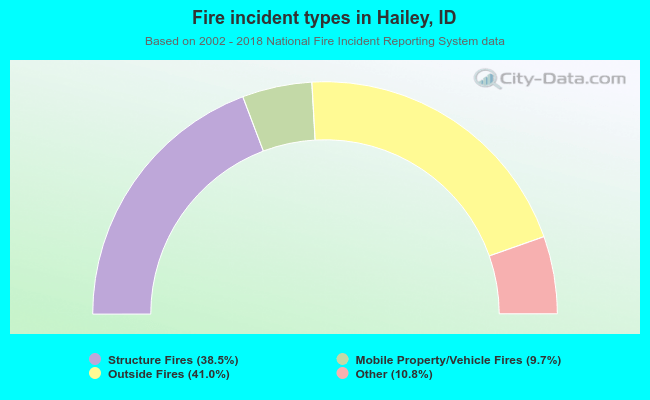 When looking into fire subcategories, the most reports belonged to: Outside Fires (41.0%), and Structure Fires (38.5%).