Gulfport: Fire Incidents, Mississippi (MS)
Where are fire incidents reported in Gulfport, MS
Something went wrong! Please refresh the page.
| Fire incidents reported | |
|---|---|
| Sreet name | Count |
| HWY 49 | 350 |
| PASS RD | 350 |
| I-10 | 210 |
| THREE RIVERS RD | 210 |
| LORRAINE RD | 156 |
| DEDEAUX RD | 136 |
| HWY 49 HWY | 134 |
| CANAL RD | 132 |
| ONEAL RD | 132 |
| 28TH ST | 120 |
| LANDON RD | 120 |
| BEACH BLVD | 118 |
| AVE | 114 |
| 25TH AVE | 106 |
| 53 HWY | 94 |
| ST | 92 |
| SEAWAY RD | 90 |
| SWITZER RD | 90 |
| CREOSOTE RD | 88 |
| 20TH ST | 86 |
| CEMETERY RD | 86 |
| COURTHOUSE RD | 84 |
| RAILROAD ST | 84 |
| 31ST ST | 82 |
| COWAN RD | 78 |
| CABLE BRIDGE RD | 76 |
| 39TH AVE | 74 |
| COUNTY FARM RD | 72 |
| ROBINSON RD | 66 |
| 19TH ST | 64 |
| Other | 3,849 |
2002 - 2018 National Fire Incident Reporting System (NFIRS) incidents
- Incident types reported to NFIRS in Gulfport, MS
- 37,20959.6%Rescue & EMS
- 7,54312.1%Fire
- 5,4018.6%Good Intent Call
- 5,2678.4%Hazardous Condition
- 4,4487.1%Service Call
- 2,4323.9%False Alarm
- Fire incident types reported to NFIRS in Gulfport, MS
- 3,59147.6%Outside Fires
- 2,19929.2%Structure Fires
- 1,23716.4%Mobile Property/Vehicle Fires
- 5166.8%Other
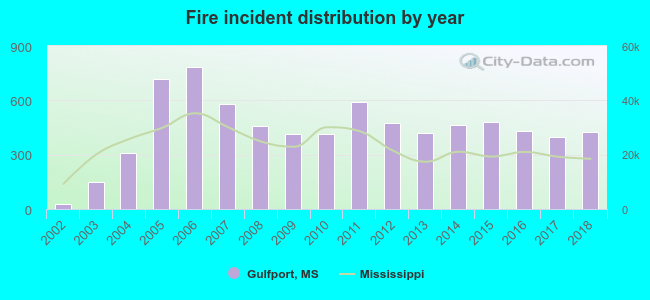 Based on the data from the years 2002 - 2018 the average number of fire incidents per year is 444. The highest number of reported fires - 785 took place in 2006, and the least - 30 in 2002. The data has an increasing trend.
The average number of yearly fire incidents per 10k residents in Gulfport, MS compared to nearest cities:
(Note: Based on data for the last 3 years, including only cities with population 5,000 and above)
| Gulfport: | 58.2 |
| Long Beach: | 30.0 |
| Biloxi: | 53.3 |
| Pass Christian: | 159.5 |
| Ocean Springs: | 102.1 |
| Diamondhead: | 24.9 |
| Waveland: | 76.9 |
| Gautier: | 53.1 |
| Vancleave: | 115.5 |
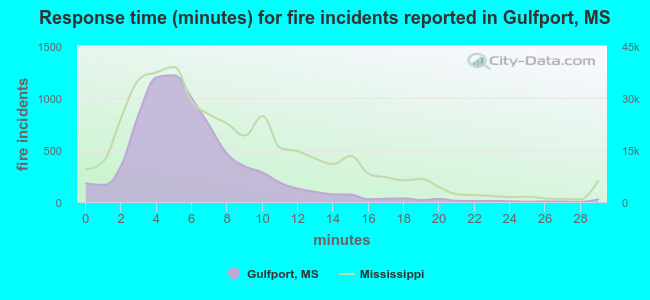 The median response time based on all reported fire incidents is 5 minutes. This is lower than the state median value.
The median response time in Gulfport, MS compared to nearest cities:
(Note: Based on data for all years, including only cities with at least 500 fire incidents)
| Gulfport: | 5 minutes |
| Long Beach: | 5 minutes |
| Biloxi: | 4 minutes |
| Pass Christian: | 6 minutes |
| Saucier: | 8 minutes |
| Ocean Springs: | 4 minutes |
| Bay St. Louis: | 5 minutes |
| Waveland: | 4 minutes |
| Kiln: | 10 minutes |
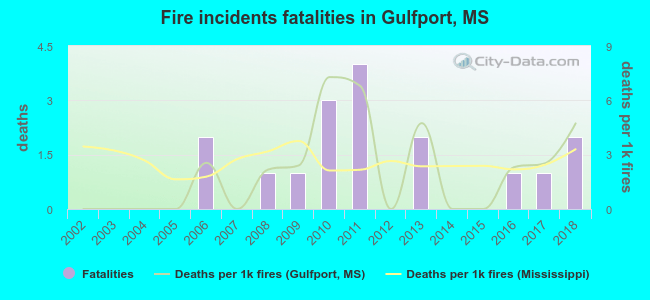 Based on the data from the years 2002 - 2018 the average number of fire-related fatalities per year is 1. The highest number of reported deaths - 4 took place in 2011, and the lowest - 0 in 2002. The data has an increasing trend.
The average number of deaths per 1,000 fires is 2. This indicator was the highest - 7 in 2010, and the lowest 0 in 2002. The trend for deaths per 1,000 fires is rising. Compared to the Mississippi value the number of fatalities per 1,000 incidents is about the same.
Based on the data from the years 2002 - 2018 the average number of fire-related fatalities per year is 1. The highest number of reported deaths - 4 took place in 2011, and the lowest - 0 in 2002. The data has an increasing trend.
The average number of deaths per 1,000 fires is 2. This indicator was the highest - 7 in 2010, and the lowest 0 in 2002. The trend for deaths per 1,000 fires is rising. Compared to the Mississippi value the number of fatalities per 1,000 incidents is about the same.Deaths per 1,000 incidents in Gulfport, MS compared to nearest cities:
(Note: Based on data for all years, including only cities with at least 2,500 fire incidents)
| Gulfport: | 2.3 |
| Biloxi: | 1.5 |
| Saucier: | 2.0 |
| Ocean Springs: | 1.1 |
| Pascagoula: | 2.6 |
| Moss Point: | 2.2 |
| Picayune: | 2.7 |
| Slidell: | 1.8 |
| Lucedale: | 1.9 |
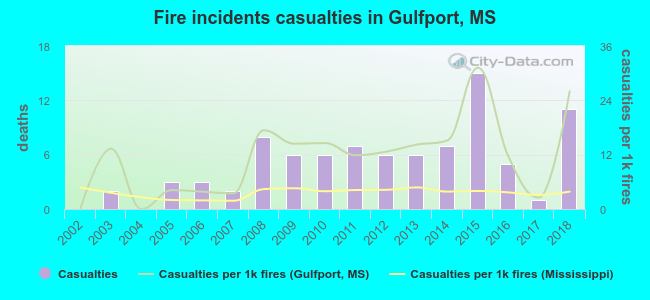 Based on the reports from the years 2002 - 2018 the average number of fire-related yearly casualties is 5. The highest number of reported casualties - 15 took place in 2015, and the lowest - 0 in 2002. The data has an increasing trend.
The average number of injuries per 1,000 fire incidents is 12. This indicator was the highest - 31 in 2015, and the lowest 0 in 2002. The trend for casualties per 1,000 fire incidents is increasing. Compared to the Mississippi value the number of injuries per 1,000 fire incidents is much higher.
Based on the reports from the years 2002 - 2018 the average number of fire-related yearly casualties is 5. The highest number of reported casualties - 15 took place in 2015, and the lowest - 0 in 2002. The data has an increasing trend.
The average number of injuries per 1,000 fire incidents is 12. This indicator was the highest - 31 in 2015, and the lowest 0 in 2002. The trend for casualties per 1,000 fire incidents is increasing. Compared to the Mississippi value the number of injuries per 1,000 fire incidents is much higher.Casualties per 1,000 incidents in Gulfport, MS compared to nearest cities:
(Note: Based on data for all years, including only cities with at least 500 fire incidents)
| Gulfport: | 11.7 |
| Long Beach: | 3.8 |
| Biloxi: | 15.1 |
| Pass Christian: | 3.0 |
| Saucier: | 6.3 |
| Ocean Springs: | 7.8 |
| Bay St. Louis: | 3.9 |
| Waveland: | 1.0 |
| Kiln: | 3.4 |
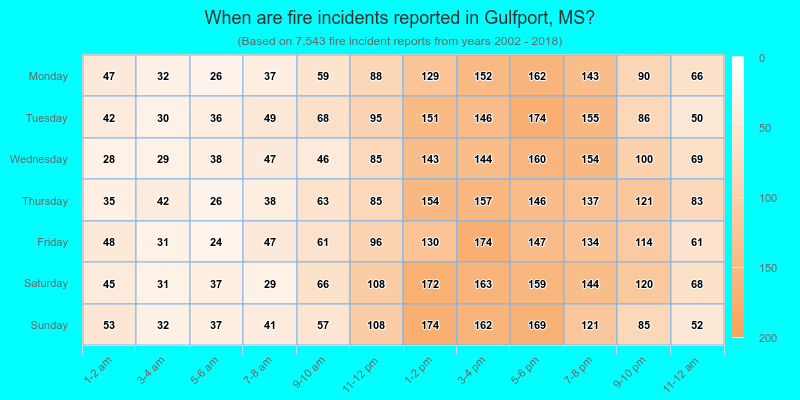
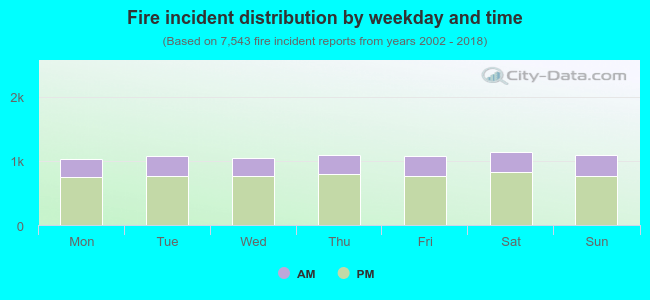 28.1% incidents where reported in the morning and 71.9% in the evening. The most fires (15.1%) took place on Saturday, and the least (13.7%) on Monday.
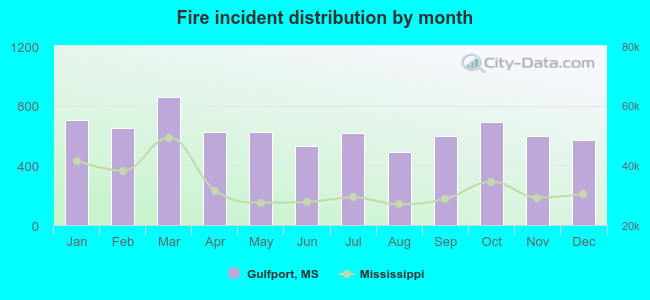 According to the 7,543 fires from years 2002 - 2018 most fires (11.4%) took place during March, and the least (6.5%) in August.
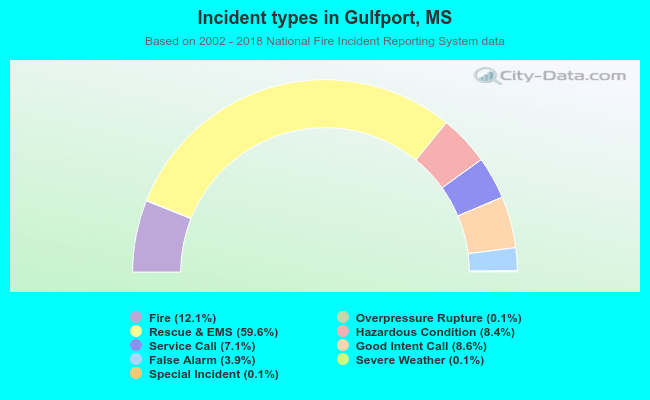 Out of all 62,451 cases reported during the years 2002 - 2018, the most belonged to the categories: Rescue & EMS (59.6%), Fire (12.1%), and Good Intent Call (8.6%).
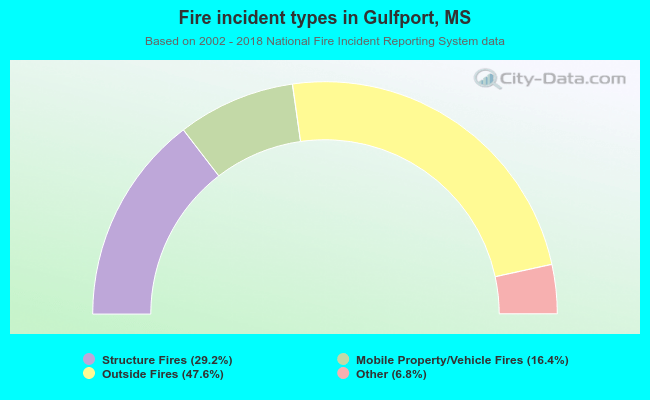 When looking into fire subcategories, the most reports belonged to: Outside Fires (47.6%), and Structure Fires (29.2%).