Greenwood: Fire Incidents, Mississippi (MS)
Where are fire incidents reported in Greenwood, MS
Something went wrong! Please refresh the page.
| Fire incidents reported | |
|---|---|
| Sreet name | Count |
| HWY 82 | 150 |
| PARK AVE | 106 |
| HIGHWAY 82 | 64 |
| MAIN ST | 60 |
| CARROLLTON AVE | 56 |
| HWY 49 | 48 |
| MARTIN LUTHER KING | 40 |
| HWY 7 | 38 |
| BROWNING RD | 36 |
| GRENADA BLVD | 34 |
| HENRY ST | 32 |
| RIVER RD | 32 |
| HWY 82 W | 30 |
| OAK ST | 30 |
| AVENUE F | 28 |
| MCLAURIN | 28 |
| BUCKEYE RD | 26 |
| ROOSEVELT | 26 |
| STATE ST | 26 |
| AVENUE E | 22 |
| BROAD ST | 22 |
| HWY 49 SOUTH | 22 |
| HWY 82 WEST | 22 |
| LEFLORE AVE | 22 |
| MISSISSIPPI AVE | 22 |
| AVENUE J | 20 |
| COTTON ST | 20 |
| HIGHWAY 7 | 20 |
| HWY 82 EAST | 20 |
| LUTHER DR | 20 |
| Other | 1,194 |
2003 - 2018 National Fire Incident Reporting System (NFIRS) incidents
- Incident types reported to NFIRS in Greenwood, MS
- 2,31658.1%Fire
- 1,21030.3%Hazardous Condition
- 3178.0%False Alarm
- 852.1%Service Call
- 310.8%Good Intent Call
- 150.4%Overpressure Rupture
- 90.2%Rescue & EMS
- Fire incident types reported to NFIRS in Greenwood, MS
- 91839.6%Structure Fires
- 66728.8%Outside Fires
- 53022.9%Mobile Property/Vehicle Fires
- 2018.7%Other
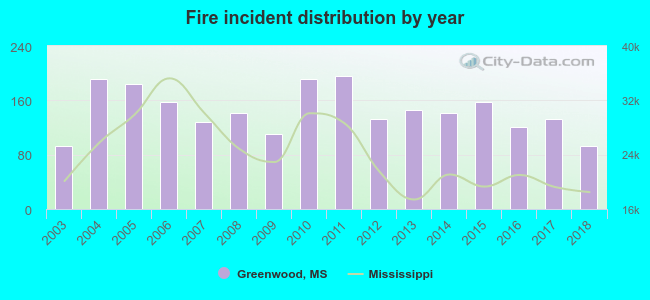 Based on the data from the years 2003 - 2018 the average number of fire incidents per year is 145. The highest number of fire incidents - 196 took place in 2011, and the least - 93 in 2003. The data has a constant trend.
The average number of yearly fire incidents per 10k residents in Greenwood, MS compared to nearest cities:
(Note: Based on data for the last 3 years, including only cities with population 5,000 and above)
| Greenwood: | 73.3 |
| Indianola: | 80.7 |
| Grenada: | 133.0 |
| Cleveland: | 91.8 |
| Kosciusko: | 78.3 |
| Yazoo City: | 108.5 |
| Greenville: | 93.1 |
| Clarksdale: | 74.5 |
 The median response time based on all reported fire incidents is 5 minutes. This is lower compared to the state median value.
The median response time in Greenwood, MS compared to nearest cities:
(Note: Based on data for all years, including only cities with at least 500 fire incidents)
| Greenwood: | 5 minutes |
| Tchula: | 11 minutes |
| Winona: | 5 minutes |
| Indianola: | 4 minutes |
| Grenada: | 4 minutes |
| Lexington: | 9 minutes |
| Belzoni: | 5 minutes |
| Charleston: | 9 minutes |
| Cleveland: | 3 minutes |
 According to the data from the years 2003 - 2018 the average number of fire-related fatalities per year is 0. The highest number of deaths - 1 took place in 2004, and the lowest - 0 in 2003. The data has an increasing trend.
 36.2% incidents where reported in the morning and 63.8% in the evening. The most fires (15.0%) took place on Monday, and the least (13.1%) on Tuesday.
 Based on the 2,316 fires from years 2003 - 2018 most fires (9.2%) took place during July, and the least (6.5%) in April.
 Out of all 3,987 cases reported during the years 2003 - 2018, the most belonged to the categories: Fire (58.1%), Hazardous Condition (30.3%), and False Alarm (8.0%).
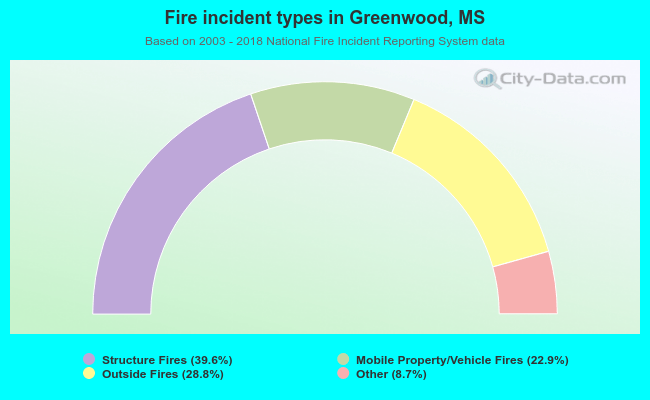 When looking into fire subcategories, the most incidents belonged to: Structure Fires (39.6%), and Outside Fires (28.8%).