Grants: Fire Incidents, New Mexico (NM)
Where are fire incidents reported in Grants, NM
Something went wrong! Please refresh the page.
|
| |||||||||||||||||||||||||||||||||||||||||||||||||||||||||||||||||||||||||||||||||||||||||||||||||||||||||||||
| Other | 185 | |||||||||||||||||||||||||||||||||||||||||||||||||||||||||||||||||||||||||||||||||||||||||||||||||||||||||||||
2006 - 2018 National Fire Incident Reporting System (NFIRS) incidents
- Incident types reported to NFIRS in Grants, NM
- 1,62043.1%Hazardous Condition
- 73519.6%Rescue & EMS
- 64317.1%Fire
- 3048.1%Service Call
- 2326.2%Good Intent Call
- 1945.2%False Alarm
- 210.6%Special Incident
- 60.2%Overpressure Rupture
- Fire incident types reported to NFIRS in Grants, NM
- 29846.3%Outside Fires
- 19830.8%Structure Fires
- 10215.9%Mobile Property/Vehicle Fires
- 457.0%Other
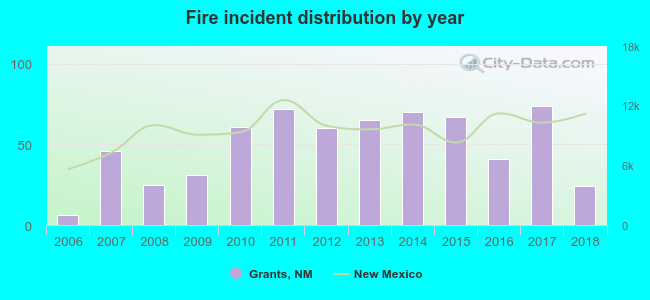 According to the data from the years 2006 - 2018 the average number of fires per year is 49. The highest number of fire incidents - 74 took place in 2017, and the least - 6 in 2006. The data has a growing trend.
The average number of yearly fire incidents per 10k residents in Grants, NM compared to nearest cities:
(Note: Based on data for the last 3 years, including only cities with population 5,000 and above)
| Grants: | 50.1 |
| Red Rock: | 0.8 |
| Zuni: | 12.9 |
| Gallup: | 69.6 |
| South Valley: | 2.0 |
| Rio Rancho: | 17.1 |
| Los Lunas: | 192.2 |
| Los Chaves: | 28.8 |
| North Valley: | 4.1 |
 The median response time based on all reported fire incidents is 4 minutes. This is much lower compared to the New Mexico median value.
The median response time in Grants, NM compared to nearest cities:
(Note: Based on data for all years, including only cities with at least 500 fire incidents)
| Grants: | 4 minutes |
| Gallup: | 6 minutes |
| Rio Rancho: | 8 minutes |
| Los Lunas: | 10 minutes |
| Belen: | 10 minutes |
| Albuquerque: | 7 minutes |
 31.7% incidents where reported in the morning and 68.3% in the evening. The most fires (17.1%) took place on Tuesday, and the least (11.2%) on Sunday.
 Based on the 643 reports from years 2006 - 2018 most fires (12.6%) took place during March, and the least (5.6%) in September.
 Out of all 3,756 cases reported during the years 2006 - 2018, the most belonged to the categories: Hazardous Condition (43.1%), Rescue & EMS (19.6%), and Fire (17.1%).
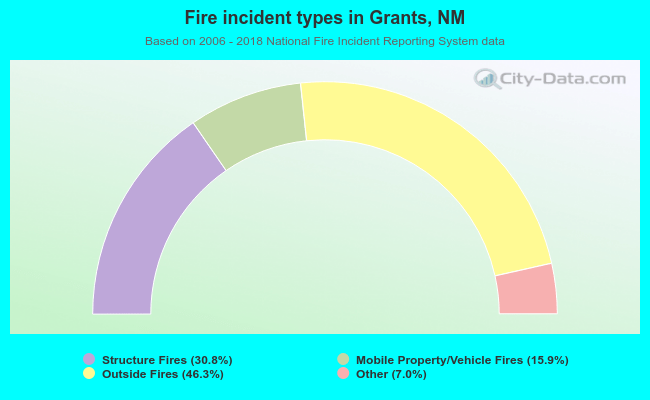 When looking into fire subcategories, the most incidents belonged to: Outside Fires (46.3%), and Structure Fires (30.8%).