Goffstown: Fire Incidents, New Hampshire (NH)
Where are fire incidents reported in Goffstown, NH
Something went wrong! Please refresh the page.
| Fire incidents reported | |
|---|---|
| Sreet name | Count |
| MAST RD | 200 |
| ST ANSELM DR | 144 |
| ELM ST | 62 |
| MAIN ST | 44 |
| SOUTH MAST ST | 44 |
| NORTH MAST ST | 40 |
| CHURCH ST | 38 |
| GOFFSTOWN BACK RD | 36 |
| CHURCH STREET | 30 |
| MOUNTAIN RD | 28 |
| WALLACE RD | 28 |
| PAIGE HILL RD | 26 |
| TIBBETTS HILL RD | 26 |
| TIRRELL HILL RD | 26 |
| DANIEL PLUMMER RD | 24 |
| CENTER ST | 22 |
| GORHAM POND RD | 22 |
| PARKER STATION RD | 22 |
| BLACK BROOK RD | 20 |
| EAST DUNBARTON RD | 20 |
| GOFFSTOWN FIRE | 18 |
| PATTEE HILL RD | 18 |
| REED ST | 18 |
| LOCUST HILL RD | 16 |
| SHIRLEY HILL RD | 16 |
| NEW BOSTON RD | 14 |
| COLLEGE RD | 12 |
| JUNIPER DR | 12 |
| LEACH HILL RD | 12 |
| MAPLE AVE | 12 |
2002 - 2018 National Fire Incident Reporting System (NFIRS) incidents
- Incident types reported to NFIRS in Goffstown, NH
- 5,52049.8%Rescue & EMS
- 1,87016.9%Service Call
- 1,41112.7%Hazardous Condition
- 9578.6%Fire
- 6976.3%False Alarm
- 5645.1%Good Intent Call
- 420.4%Severe Weather
- Fire incident types reported to NFIRS in Goffstown, NH
- 62865.6%Structure Fires
- 24325.4%Outside Fires
- 757.8%Mobile Property/Vehicle Fires
- 111.1%Other
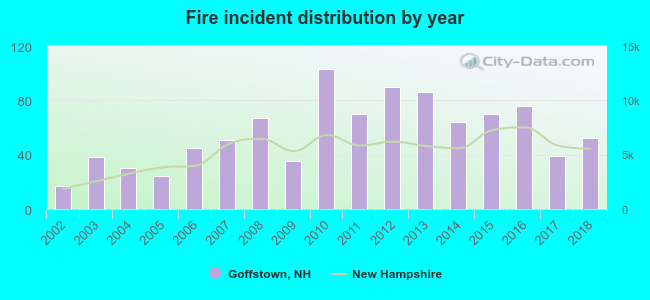 Based on the data from the years 2002 - 2018 the average number of fires per year is 56. The highest number of reported fire incidents - 103 took place in 2010, and the least - 17 in 2002. The data has a growing trend.
The average number of yearly fire incidents per 10k residents in Goffstown, NH compared to nearest cities:
(Note: Based on data for the last 3 years, including only cities with population 5,000 and above)
| Goffstown: | 31.5 |
| Bedford: | 24.5 |
| Manchester: | 27.2 |
| New Boston: | 67.0 |
| Bow: | 72.7 |
| Weare: | 58.1 |
| Merrimack: | 28.8 |
| Amherst: | 21.4 |
| Pembroke: | 20.6 |
 The median response time based on all reported fire incidents is 6 minutes. This is about the same as the New Hampshire median value.
The median response time in Goffstown, NH compared to nearest cities:
(Note: Based on data for all years, including only cities with at least 500 fire incidents)
| Goffstown: | 6 minutes |
| Bedford: | 7 minutes |
| Manchester: | 5 minutes |
| Hooksett: | 8 minutes |
| Bow: | 8 minutes |
| Weare: | 11 minutes |
| Merrimack: | 6 minutes |
| Amherst: | 8 minutes |
| Milford: | 6 minutes |
 Based on the data from the years 2002 - 2018 the average number of fire-related yearly casualties is 1. The highest number of casualties - 4 took place in 2008, and the lowest - 0 in 2002. The data has an increasing trend.
The average number of casualties per 1,000 fire incidents is 15. This indicator was the highest - 60 in 2008, and the lowest 0 in 2002. The trend for injuries per 1,000 incidents is growing. Compared to the New Hampshire value the number of casualties per 1,000 fires is higher.
Based on the data from the years 2002 - 2018 the average number of fire-related yearly casualties is 1. The highest number of casualties - 4 took place in 2008, and the lowest - 0 in 2002. The data has an increasing trend.
The average number of casualties per 1,000 fire incidents is 15. This indicator was the highest - 60 in 2008, and the lowest 0 in 2002. The trend for injuries per 1,000 incidents is growing. Compared to the New Hampshire value the number of casualties per 1,000 fires is higher.
 35.1% incidents where reported in the morning and 64.9% in the evening. The most fires (16.0%) took place on Monday, and the least (13.0%) on Friday.
 Based on the 957 reports from years 2002 - 2018 most fires (11.1%) took place during January, and the least (5.2%) in November.
 Out of all 11,076 cases reported during the years 2002 - 2018, the most belonged to the categories: Rescue & EMS (49.8%), Service Call (16.9%), and Hazardous Condition (12.7%).
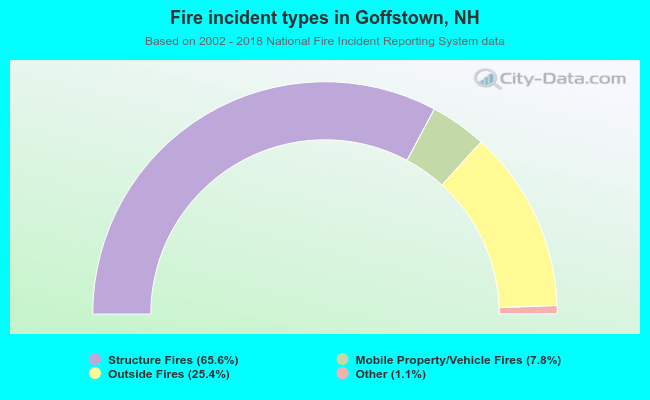 When looking into fire subcategories, the most reports belonged to: Structure Fires (65.6%), and Outside Fires (25.4%).