Glenn Dale: Fire Incidents, Maryland (MD)
Where are fire incidents reported in Glenn Dale, MD
Something went wrong! Please refresh the page.
|
| |||||||||||||||||||||||||||||||||||||||||||||||||||||||||||||||||||||||||||||||||||||||||||||||||||||||||||||
2009 - 2018 National Fire Incident Reporting System (NFIRS) incidents
- Incident types reported to NFIRS in Glenn Dale, MD
- 54143.2%Rescue & EMS
- 20416.3%Hazardous Condition
- 17914.3%Fire
- 16613.2%False Alarm
- 1229.7%Service Call
- 413.3%Good Intent Call
- Fire incident types reported to NFIRS in Glenn Dale, MD
- 8245.8%Structure Fires
- 4324.0%Outside Fires
- 3720.7%Other
- 179.5%Mobile Property/Vehicle Fires
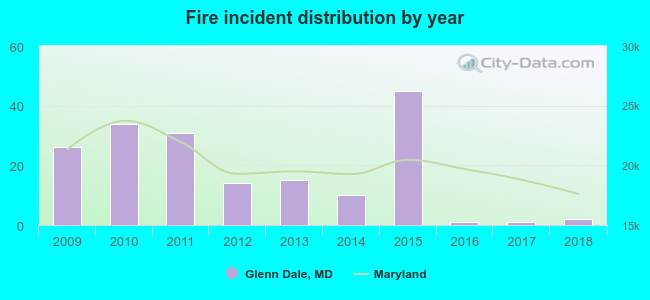 Based on the data from the years 2009 - 2018 the average number of fires per year is 18. The highest number of fires - 45 took place in 2015, and the least - 1 in 2016. The data has a dropping trend.
The average number of yearly fire incidents per 10k residents in Glenn Dale, MD compared to nearest cities:
(Note: Based on data for the last 3 years, including only cities with population 5,000 and above)
| Glenn Dale: | 1.0 |
| Lanham: | 14.1 |
| Bowie: | 7.9 |
| Greenbelt: | 3.5 |
| Landover: | 3.2 |
| College Park: | 2.5 |
| Crofton: | 14.3 |
| Beltsville: | 17.5 |
| Bladensburg: | 3.5 |

 According to the reports from the years 2009 - 2018 the average number of fire-related yearly casualties is 0. The highest number of casualties - 1 took place in 2009, and the lowest - 0 in 2010. The data has a dropping trend.
 28.5% incidents where reported in the morning and 71.5% in the evening. The most fires (19.0%) took place on Saturday, and the least (10.6%) on Wednesday.
 According to the 179 fire incident reports from years 2009 - 2018 most fires (12.8%) took place during June, and the least (2.2%) in November.
 Out of all 1,253 cases reported during the years 2009 - 2018, the most belonged to the categories: Overpressure Rupture (43.2%), Rescue & EMS (16.3%), and Fire (14.3%).
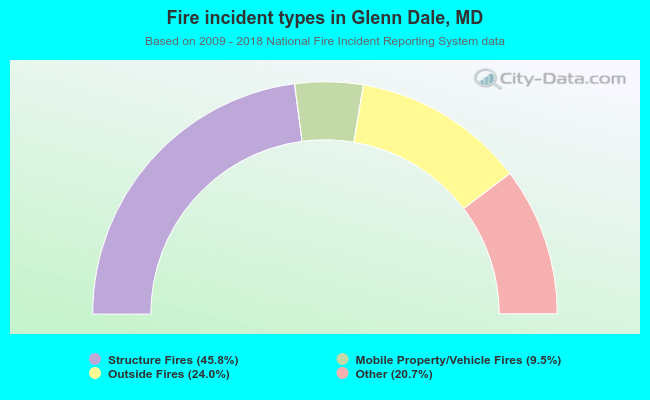 When looking into fire subcategories, the most incidents belonged to: Structure Fires (45.8%), and Outside Fires (24.0%).