Freeland: Fire Incidents, Michigan (MI)
Where are fire incidents reported in Freeland, MI
Something went wrong! Please refresh the page.
|
| |||||||||||||||||||||||||||||||||||||||||||||||||||||||||||||||||||||||||||||||||||||||||||||||||||||||||||||
2002 - 2018 National Fire Incident Reporting System (NFIRS) incidents
- Incident types reported to NFIRS in Freeland, MI
- 1,43455.8%Rescue & EMS
- 39815.5%Hazardous Condition
- 26510.3%Fire
- 2118.2%Good Intent Call
- 1515.9%Service Call
- 1013.9%False Alarm
- 50.2%Special Incident
- Fire incident types reported to NFIRS in Freeland, MI
- 11744.2%Structure Fires
- 7929.8%Outside Fires
- 6424.2%Mobile Property/Vehicle Fires
- 51.9%Other
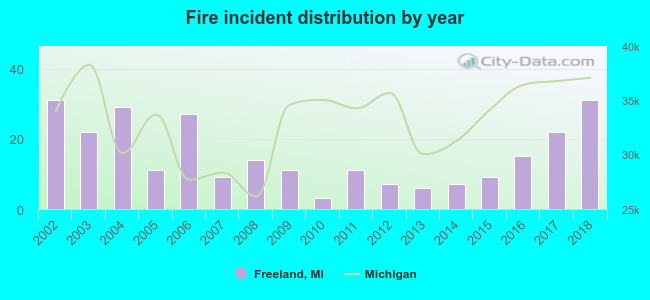 Based on the data from the years 2002 - 2018 the average number of fire incidents per year is 16. The highest number of reported fire incidents - 31 took place in 2002, and the least - 3 in 2010. The data has a constant trend.
The average number of yearly fire incidents per 10k residents in Freeland, MI compared to nearest cities:
(Note: Based on data for the last 3 years, including only cities with population 5,000 and above)
| Freeland: | 32.5 |
| Midland: | 37.2 |
| Carrollton: | 8.9 |
| Saginaw: | 121.3 |
| Bay City: | 61.5 |
| Buena Vista: | 2.9 |
| Bridgeport: | 13.4 |
| Alma: | 58.9 |
| Mount Pleasant: | 0.9 |
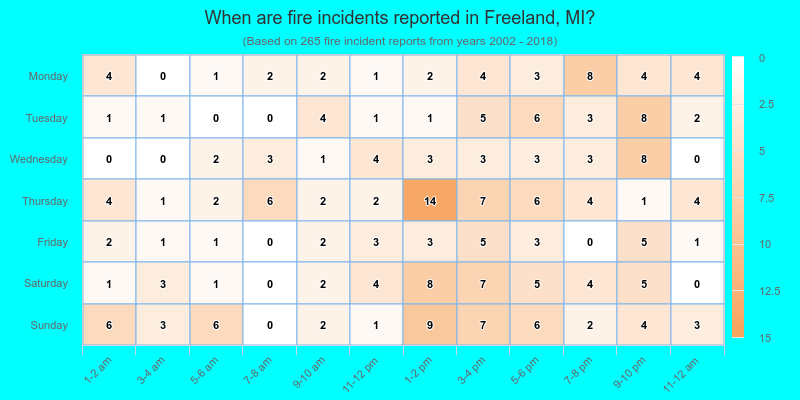
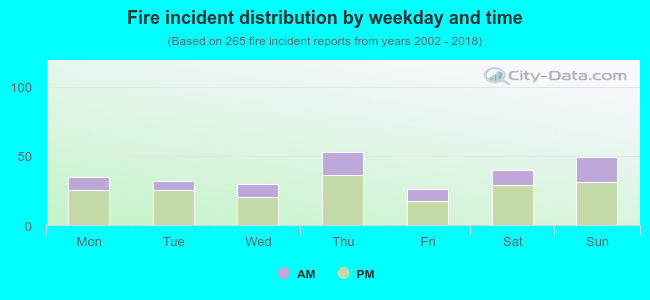 30.9% incidents where reported in the morning and 69.1% in the evening. The most fires (20.0%) took place on Thursday, and the least (9.8%) on Friday.
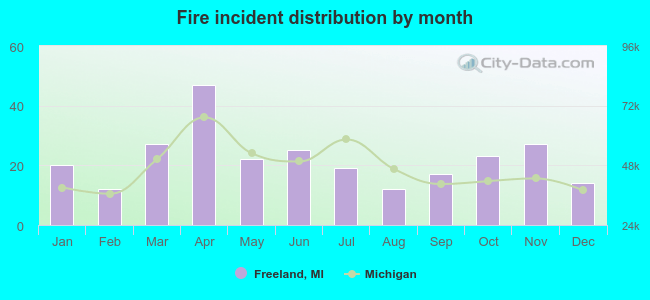 Based on the 265 fires from years 2002 - 2018 most fires (17.7%) took place during April, and the least (4.5%) in February.
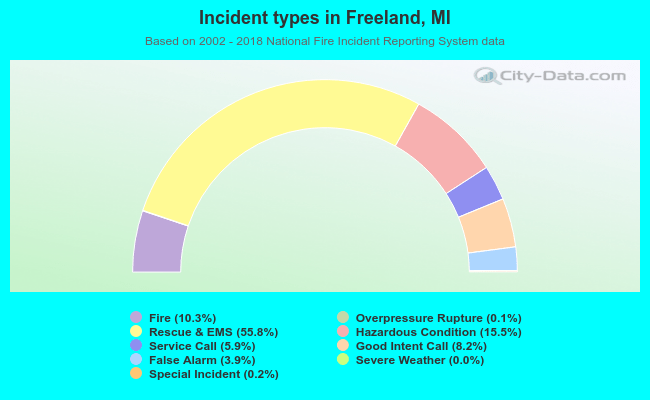 Out of all 2,568 cases reported during the years 2002 - 2018, the most belonged to the categories: Rescue & EMS (55.8%), Hazardous Condition (15.5%), and Fire (10.3%).
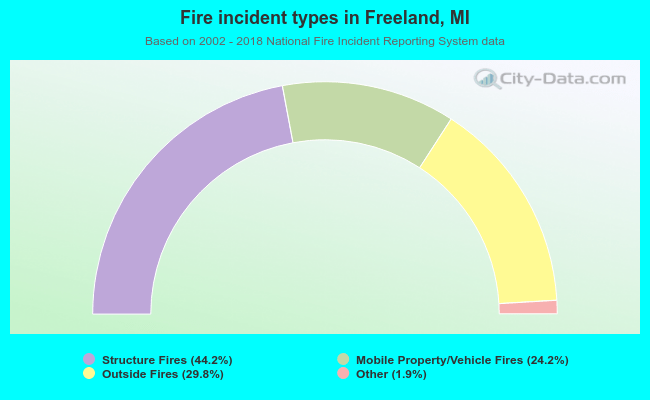 When looking into fire subcategories, the most reports belonged to: Structure Fires (44.2%), and Outside Fires (29.8%).