Franklin: Fire Incidents, Pennsylvania (PA)
Where are fire incidents reported in Franklin, PA
Something went wrong! Please refresh the page.
|
| |||||||||||||||||||||||||||||||||||||||||||||||||||||||||||||||||||||||||||||||||||||||||||||||||||||||||||||
2003 - 2018 National Fire Incident Reporting System (NFIRS) incidents
- Incident types reported to NFIRS in Franklin, PA
- 1,65741.0%Rescue & EMS
- 69217.1%Service Call
- 57114.1%Hazardous Condition
- 53213.1%Fire
- 3007.4%False Alarm
- 2446.0%Good Intent Call
- 260.6%Severe Weather
- 190.5%Special Incident
- 50.1%Overpressure Rupture
- Fire incident types reported to NFIRS in Franklin, PA
- 26650.0%Structure Fires
- 10720.1%Outside Fires
- 8415.8%Other
- 7514.1%Mobile Property/Vehicle Fires
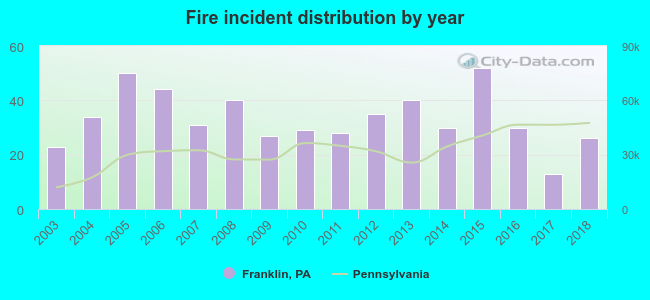 Based on the data from the years 2003 - 2018 the average number of fire incidents per year is 33. The highest number of reported fires - 52 took place in 2015, and the least - 13 in 2017. The data has an increasing trend.
The average number of yearly fire incidents per 10k residents in Franklin, PA compared to nearest cities:
(Note: Based on data for the last 3 years, including only cities with population 5,000 and above)
| Franklin: | 36.2 |
| Sugarcreek: | 7.1 |
| Oil City: | 35.2 |
| Titusville: | 66.4 |
| Grove City: | 32.1 |
| Meadville: | 117.1 |
| Greenville: | 134.0 |
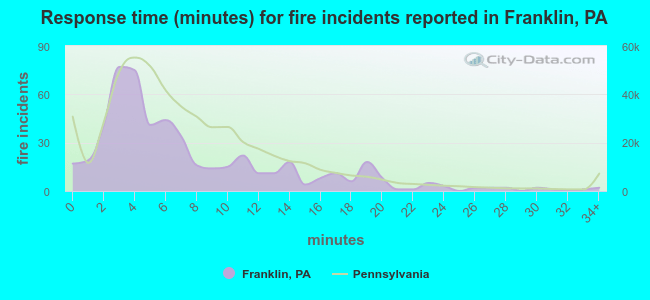 The median response time based on all reported fire incidents is 5 minutes. This is lower compared to the state median value.
The median response time in Franklin, PA compared to nearest cities:
(Note: Based on data for all years, including only cities with at least 500 fire incidents)
| Franklin: | 5 minutes |
| Oil City: | 4 minutes |
| Grove City: | 10 minutes |
| Meadville: | 6 minutes |
| Greenville: | 6 minutes |
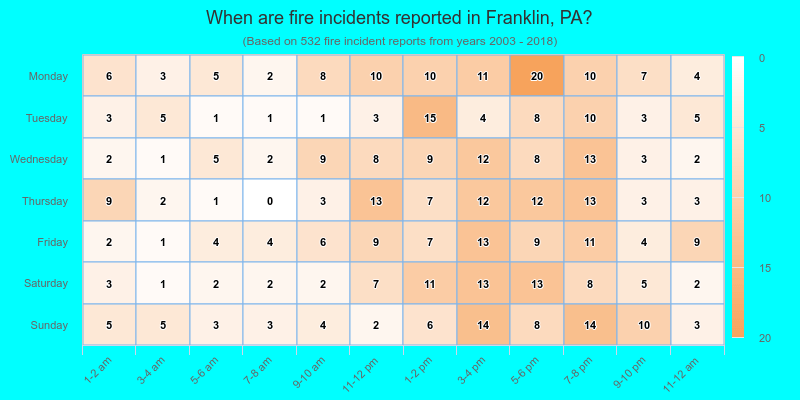
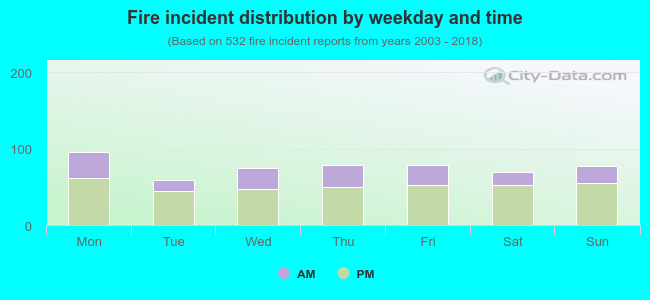 31.6% incidents where reported in the morning and 68.4% in the evening. The most fires (18.0%) took place on Monday, and the least (11.1%) on Tuesday.
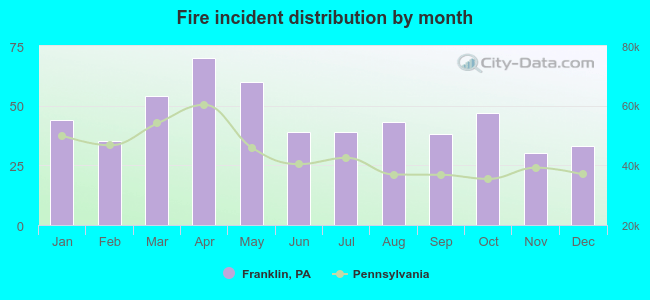 Based on the 532 fires from years 2003 - 2018 most fires (13.2%) took place during April, and the least (5.6%) in November.
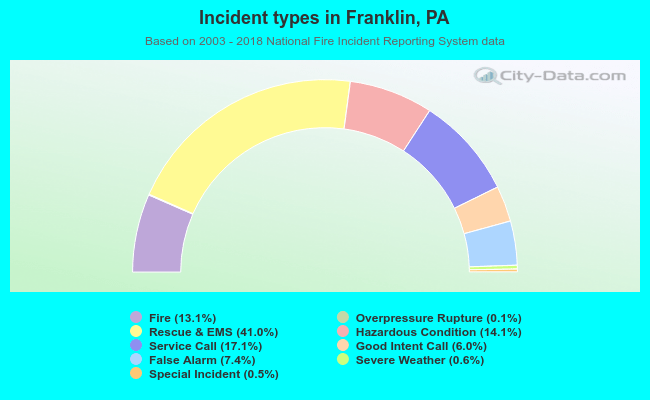 Out of all 4,046 cases reported during the years 2003 - 2018, the most belonged to the categories: Rescue & EMS (41.0%), Service Call (17.1%), and Hazardous Condition (14.1%).
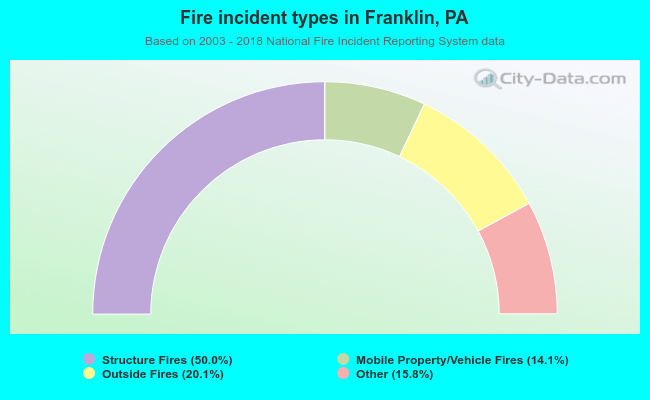 When looking into fire subcategories, the most reports belonged to: Structure Fires (50.0%), and Outside Fires (20.1%).