Fairbanks: Fire Incidents, Alaska (AK)
Where are fire incidents reported in Fairbanks, AK
Something went wrong! Please refresh the page.
| Fire incidents reported | |
|---|---|
| Sreet name | Count |
| AIRPORT WAY | 486 |
| OLD STEESE HWY | 304 |
| COLLEGE RD | 248 |
| CUSHMAN ST | 226 |
| UNIVERSITY AVE | 188 |
| CHENA PUMP RD | 164 |
| FARMER'S LOOP RD | 164 |
| DAVIS RD | 126 |
| FARMERS LOOP RD | 114 |
| PARKS HWY | 110 |
| PHILLIPS FIELD RD | 96 |
| VAN HORN RD | 94 |
| LATHROP ST | 88 |
| PEGER RD | 84 |
| GOLDSTREAM RD | 82 |
| OLD CHENA RIDGE RD | 80 |
| THOMAS ST | 80 |
| OLD RICHARDSON HWY | 76 |
| GOLDHILL RD | 74 |
| STEESE HWY | 68 |
| CHENA RIDGE RD | 66 |
| GEIST RD | 64 |
| LITTLE SHOT RD | 64 |
| 2ND AVE | 62 |
| CHENA HOT SPRINGS RD | 62 |
| GILLAM WAY | 62 |
| JONES RD | 62 |
| NOBLE ST | 62 |
| TURNER ST | 62 |
| JOHANSEN EXPY | 58 |
| Other | 3,176 |
2002 - 2018 National Fire Incident Reporting System (NFIRS) incidents
- Incident types reported to NFIRS in Fairbanks, AK
- 27,30458.2%Rescue & EMS
- 6,75214.4%Fire
- 5,58311.9%Good Intent Call
- 2,9006.2%False Alarm
- 2,5815.5%Hazardous Condition
- 1,6703.6%Service Call
- 770.2%Special Incident
- Fire incident types reported to NFIRS in Fairbanks, AK
- 3,41050.5%Structure Fires
- 2,17032.1%Outside Fires
- 1,13116.8%Mobile Property/Vehicle Fires
- 410.6%Other
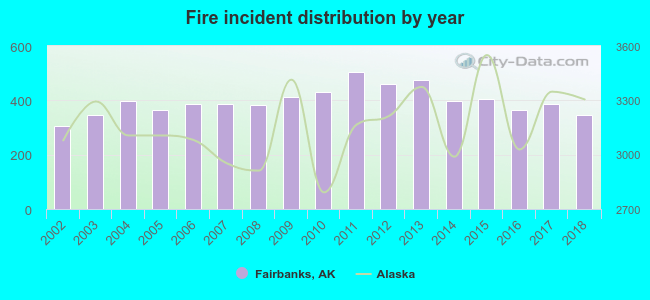 According to the data from the years 2002 - 2018 the average number of fires per year is 397. The highest number of reported fires - 504 took place in 2011, and the least - 305 in 2002. The data has a rising trend.
The average number of yearly fire incidents per 10k residents in Fairbanks, AK compared to nearest cities:
(Note: Based on data for the last 3 years, including only cities with population 5,000 and above)
| Fairbanks: | 112.6 |
| College: | 0.8 |
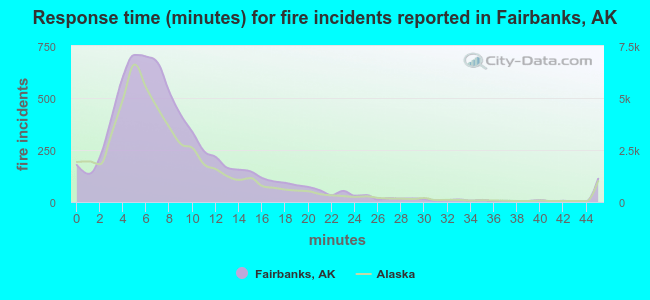 The median response time based on all reported fire incidents is 7 minutes. This is comparable to the state median value.
The median response time in Fairbanks, AK compared to nearest cities:
(Note: Based on data for all years, including only cities with at least 500 fire incidents)
| Fairbanks: | 7 minutes |
| North Pole: | 7 minutes |
| Delta Junction: | 12 minutes |
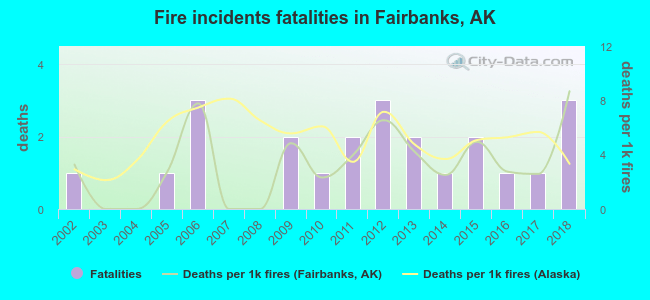 Based on the reports from the years 2002 - 2018 the average number of fire-related yearly deaths is 1. The highest number of deaths - 3 took place in 2006, and the lowest - 0 in 2003. The data has an increasing trend.
The average number of deaths per 1,000 fire incidents is 3. This indicator was the highest - 9 in 2018, and the lowest 0 in 2003. The trend for fatalities per 1,000 fires is increasing. Compared to the state value the number of deaths per 1,000 fire incidents is lower.
Based on the reports from the years 2002 - 2018 the average number of fire-related yearly deaths is 1. The highest number of deaths - 3 took place in 2006, and the lowest - 0 in 2003. The data has an increasing trend.
The average number of deaths per 1,000 fire incidents is 3. This indicator was the highest - 9 in 2018, and the lowest 0 in 2003. The trend for fatalities per 1,000 fires is increasing. Compared to the state value the number of deaths per 1,000 fire incidents is lower.Deaths per 1,000 incidents in Fairbanks, AK compared to nearest cities:
(Note: Based on data for all years, including only cities with at least 2,500 fire incidents)
| Fairbanks: | 3.4 |
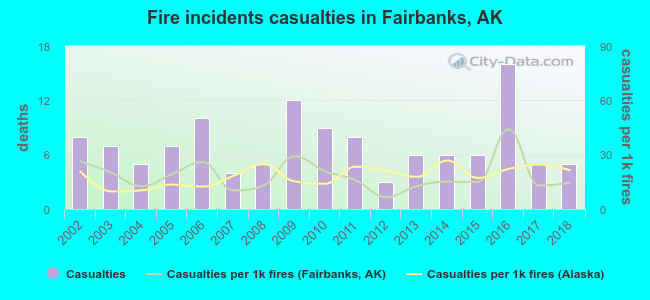 According to the data from the years 2002 - 2018 the average number of fire-related yearly casualties is 7. The highest number of reported injuries - 16 took place in 2016, and the lowest - 3 in 2012. The data has a decreasing trend.
The average number of injuries per 1,000 fire incidents is 18. This indicator was the highest - 44 in 2016, and the lowest 7 in 2012. The trend for injuries per 1,000 fire incidents is decreasing. Compared to the Alaska value the number of casualties per 1,000 fires is about the same.
According to the data from the years 2002 - 2018 the average number of fire-related yearly casualties is 7. The highest number of reported injuries - 16 took place in 2016, and the lowest - 3 in 2012. The data has a decreasing trend.
The average number of injuries per 1,000 fire incidents is 18. This indicator was the highest - 44 in 2016, and the lowest 7 in 2012. The trend for injuries per 1,000 fire incidents is decreasing. Compared to the Alaska value the number of casualties per 1,000 fires is about the same.Casualties per 1,000 incidents in Fairbanks, AK compared to nearest cities:
(Note: Based on data for all years, including only cities with at least 500 fire incidents)
| Fairbanks: | 18.1 |
| North Pole: | 10.0 |
| Delta Junction: | 8.6 |
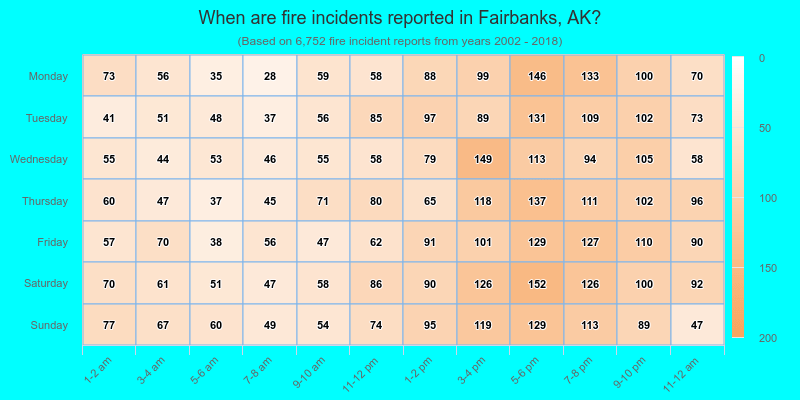
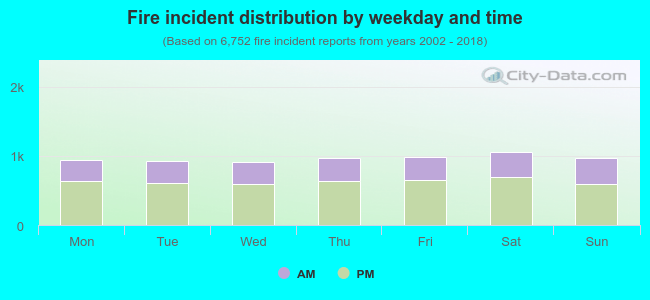 35.0% incidents where reported in the morning and 65.0% in the evening. The most fires (15.7%) took place on Saturday, and the least (13.5%) on Wednesday.
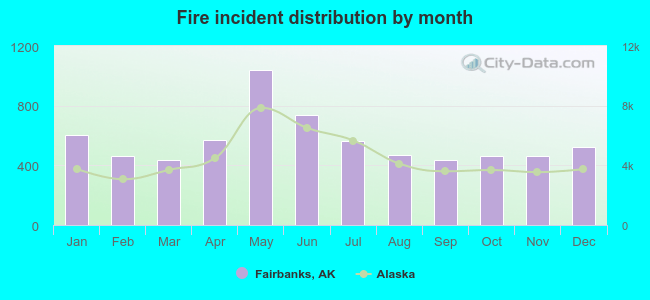 Based on the 6,752 incident reports from years 2002 - 2018 most fires (15.4%) took place during May, and the least (6.4%) in September.
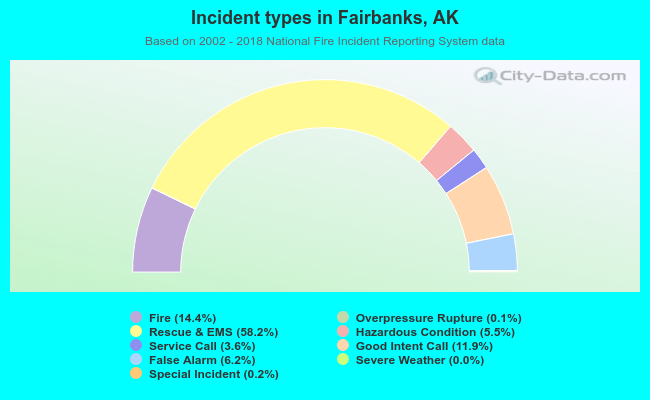 Out of all 46,903 cases reported during the years 2002 - 2018, the most belonged to the categories: Rescue & EMS (58.2%), Fire (14.4%), and Good Intent Call (11.9%).
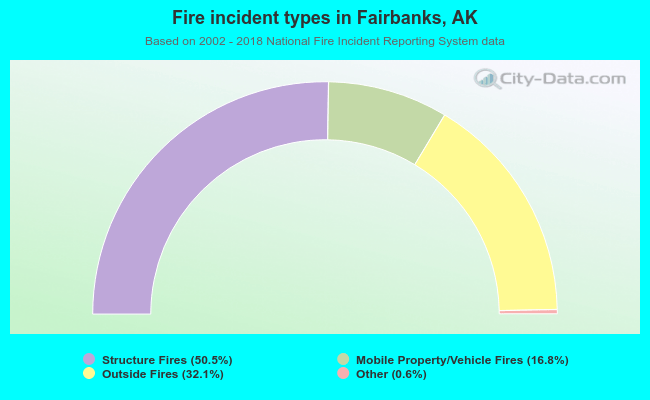 When looking into fire subcategories, the most incidents belonged to: Structure Fires (50.5%), and Outside Fires (32.1%).