Evans: Fire Incidents, New York (NY)
Where are fire incidents reported in Evans, NY
Something went wrong! Please refresh the page.
|
| |||||||||||||||||||||||||||||||||||||||||||||||||||||||||||||||||||||||||||||||||||||||||||||||||||||||||||||
2002 - 2018 National Fire Incident Reporting System (NFIRS) incidents
- Incident types reported to NFIRS in Evans, NY
- 28841.9%Rescue & EMS
- 14120.5%Fire
- 7911.5%Hazardous Condition
- 7911.5%Service Call
- 608.7%False Alarm
- 253.6%Good Intent Call
- 91.3%Severe Weather
- 60.9%Special Incident
- Fire incident types reported to NFIRS in Evans, NY
- 7754.6%Structure Fires
- 3021.3%Mobile Property/Vehicle Fires
- 2215.6%Outside Fires
- 128.5%Other
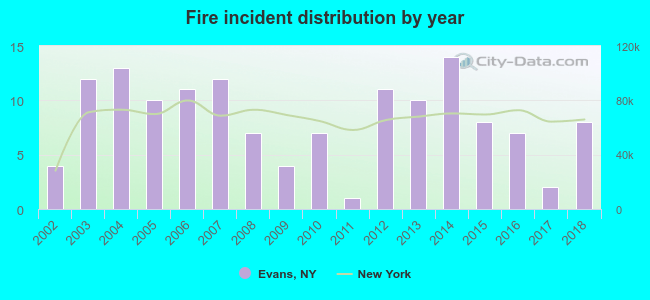 Based on the data from the years 2002 - 2018 the average number of fires per year is 8. The highest number of fires - 14 took place in 2014, and the least - 1 in 2011. The data has a rising trend.
The average number of yearly fire incidents per 10k residents in Evans, NY compared to nearest cities:
(Note: Based on data for the last 3 years, including only cities with population 5,000 and above)
| Evans: | 3.5 |
| Hamburg: | 177.0 |
| Collins: | 12.1 |
| Boston: | 30.7 |
| Lackawanna: | 37.7 |
| Dunkirk: | 51.0 |
| Concord: | 2.4 |
| West Seneca: | 37.2 |
| Buffalo: | 16.1 |
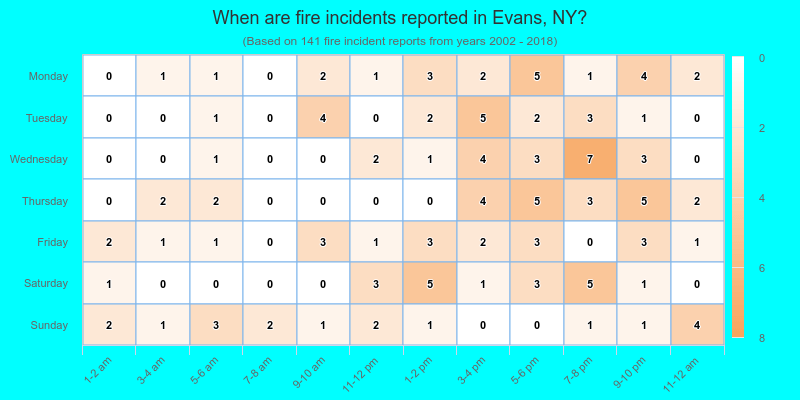
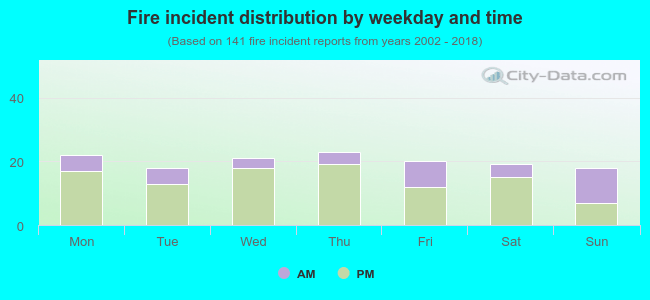 28.4% incidents where reported in the morning and 71.6% in the evening. The most fires (16.3%) took place on Thursday, and the least (12.8%) on Tuesday.
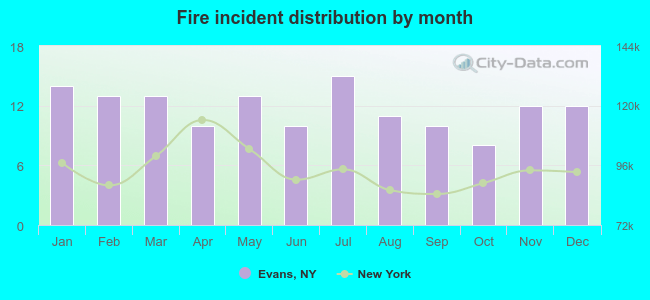 Based on the 141 fire incidents from years 2002 - 2018 most fires (10.6%) took place during July, and the least (5.7%) in October.
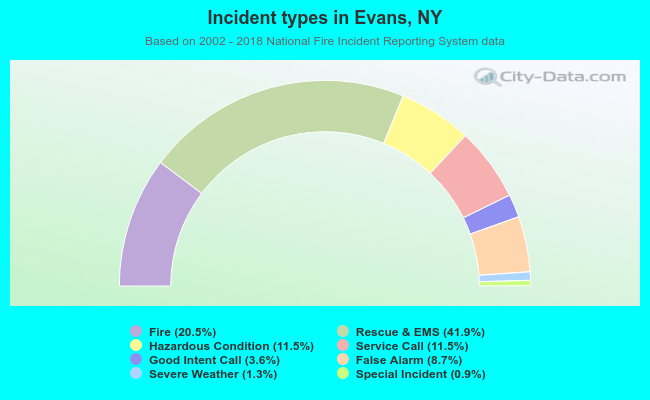 Out of all 687 cases reported during the years 2002 - 2018, the most belonged to the categories: Overpressure Rupture (41.9%), Fire (20.5%), and Rescue & EMS (11.5%).
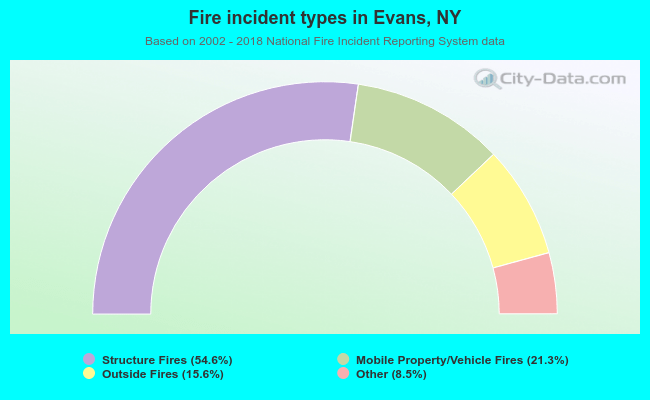 When looking into fire subcategories, the most reports belonged to: Structure Fires (54.6%), and Mobile Property/Vehicle Fires (21.3%).