Eufaula: Fire Incidents, Alabama (AL)
Where are fire incidents reported in Eufaula, AL
Something went wrong! Please refresh the page.
|
| |||||||||||||||||||||||||||||||||||||||||||||||||||||||||||||||||||||||||||||||||||||||||||||||||||||||||||||
2004 - 2018 National Fire Incident Reporting System (NFIRS) incidents
- Incident types reported to NFIRS in Eufaula, AL
- 61761.4%Fire
- 15515.4%Hazardous Condition
- 15215.1%Rescue & EMS
- 383.8%Service Call
- 323.2%Good Intent Call
- 70.7%False Alarm
- 20.2%Severe Weather
- Fire incident types reported to NFIRS in Eufaula, AL
- 24639.9%Outside Fires
- 20733.5%Structure Fires
- 9515.4%Mobile Property/Vehicle Fires
- 6911.2%Other
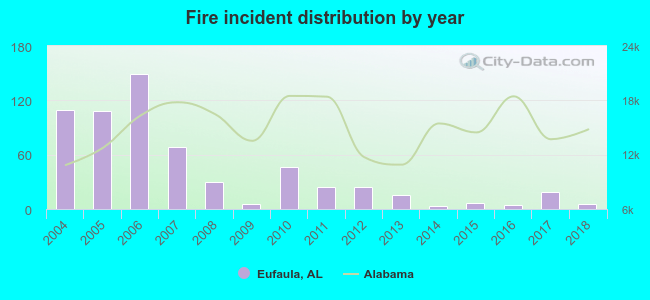 Based on the data from the years 2004 - 2018 the average number of fires per year is 41. The highest number of reported fires - 149 took place in 2006, and the least - 3 in 2014. The data has a dropping trend.
The average number of yearly fire incidents per 10k residents in Eufaula, AL compared to nearest cities:
(Note: Based on data for the last 3 years, including only cities with population 5,000 and above)
| Eufaula: | 7.3 |
| Phenix City: | 37.5 |
| Ozark: | 43.5 |
| Smiths: | 13.9 |
| Smiths Station: | 80.0 |
| Dothan: | 47.1 |
| Troy: | 51.4 |
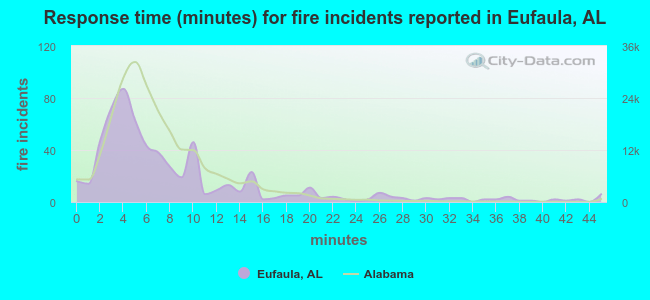 The median response time based on all reported fire incidents is 6 minutes. This is comparable to the Alabama median value.
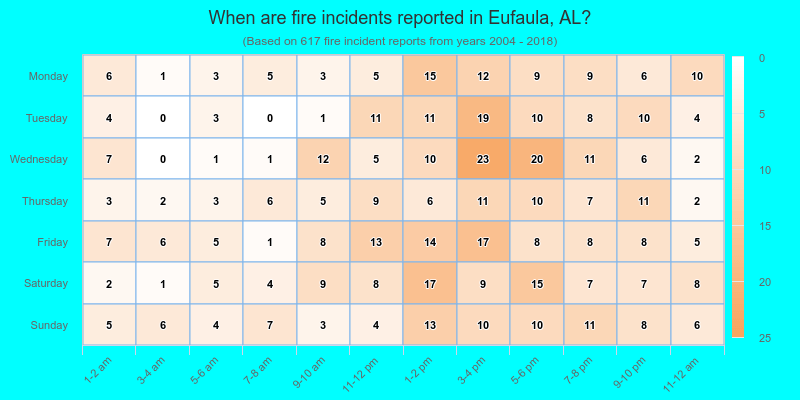
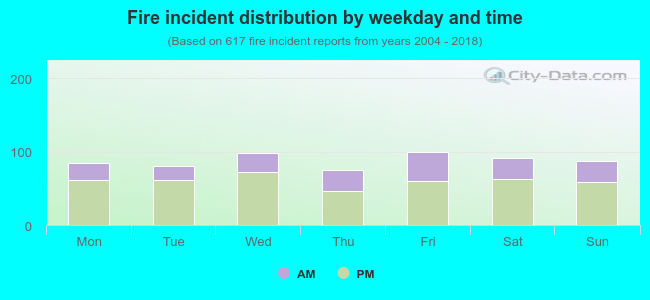 31.4% incidents where reported in the morning and 68.6% in the evening. The most fires (16.2%) took place on Friday, and the least (12.2%) on Thursday.
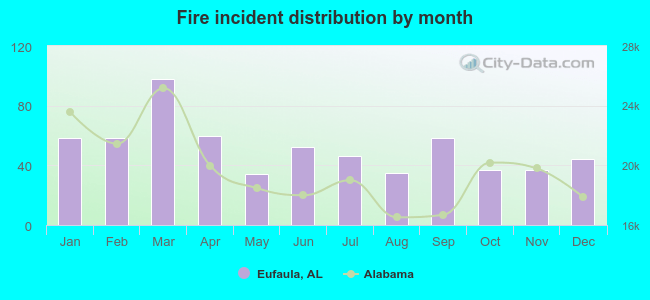 According to the 617 fires from years 2004 - 2018 most fires (15.9%) took place during March, and the least (5.5%) in May.
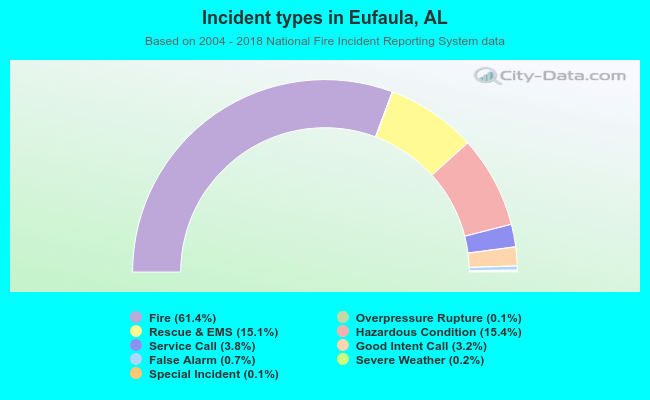 Out of all 1,005 cases reported during the years 2004 - 2018, the most belonged to the categories: Fire (61.4%), Hazardous Condition (15.4%), and Rescue & EMS (15.1%).
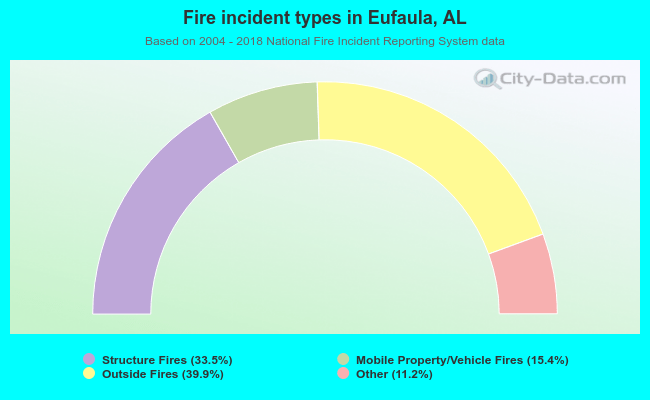 When looking into fire subcategories, the most incidents belonged to: Outside Fires (39.9%), and Structure Fires (33.5%).