Enid: Fire Incidents, Oklahoma (OK)
Where are fire incidents reported in Enid, OK
Something went wrong! Please refresh the page.
| Fire incidents reported | |
|---|---|
| Sreet name | Count |
| VAN BUREN ST | 136 |
| OWEN K GARRIOTT RD | 124 |
| WILLOW RD | 114 |
| RANDOLPH AVE | 98 |
| GARRIOTT | 96 |
| CHESTNUT AVE | 90 |
| BROADWAY AVE | 80 |
| OKLAHOMA AVE | 78 |
| 30TH | 76 |
| MAINE ST | 74 |
| GARRIOTT RD | 72 |
| WILLOW | 72 |
| CHEROKEE AVE | 68 |
| CHESTNUT | 68 |
| MAPLE AVE | 68 |
| PINE AVE | 68 |
| VAN BUREN | 68 |
| SOUTHGATE RD | 64 |
| BROADWAY | 62 |
| LEONA MITCHELL BLVD | 60 |
| RANDOLPH | 60 |
| 30TH ST | 56 |
| OAKWOOD RD | 56 |
| GARLAND RD | 54 |
| MAINE | 54 |
| OAKWOOD | 52 |
| 10TH ST | 50 |
| 4TH ST | 50 |
| GRAND | 50 |
| CHEROKEE | 48 |
| Other | 1,016 |
2002 - 2018 National Fire Incident Reporting System (NFIRS) incidents
- Incident types reported to NFIRS in Enid, OK
- 7,84941.1%Rescue & EMS
- 3,19716.7%Service Call
- 3,18216.7%Fire
- 2,29112.0%Hazardous Condition
- 1,4927.8%False Alarm
- 1,0385.4%Good Intent Call
- 320.2%Overpressure Rupture
- Fire incident types reported to NFIRS in Enid, OK
- 1,50347.2%Outside Fires
- 1,03032.4%Structure Fires
- 49415.5%Mobile Property/Vehicle Fires
- 1554.9%Other
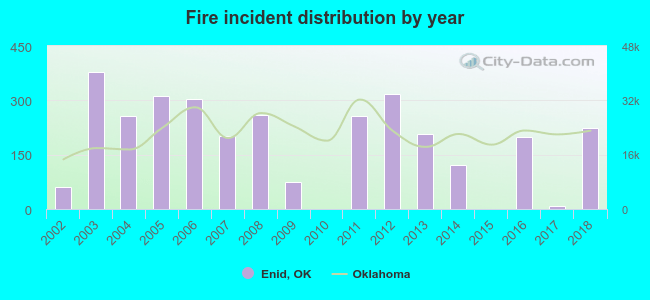 Based on the data from the years 2002 - 2018 the average number of fire incidents per year is 187. The highest number of fire incidents - 378 took place in 2003, and the least - 0 in 2010. The data has an increasing trend.
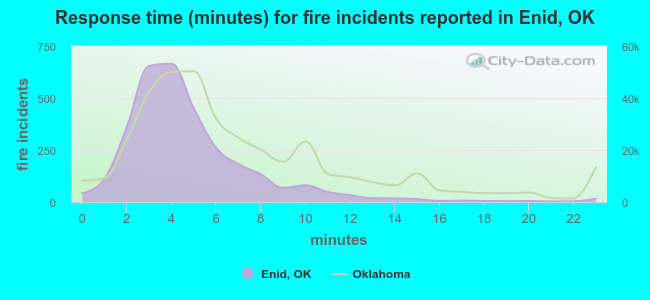 The median response time based on all reported fire incidents is 4 minutes. This is lower than the state median value.
The median response time in Enid, OK compared to nearest cities:
(Note: Based on data for all years, including only cities with at least 500 fire incidents)
| Enid: | 4 minutes |
| Perry: | 8 minutes |
| Fairview: | 11 minutes |
| Tonkawa: | 5 minutes |
| Kingfisher: | 6 minutes |
| Blackwell: | 5 minutes |
| Guthrie: | 8 minutes |
| Okarche: | 12 minutes |
| Watonga: | 11 minutes |
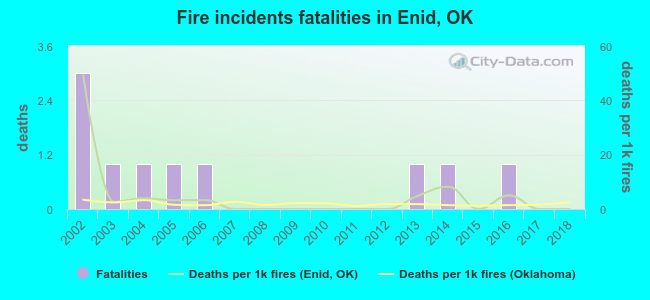 Based on the data from the years 2002 - 2018 the average number of fire-related yearly deaths is 1. The highest number of deaths - 3 took place in 2002, and the lowest - 0 in 2007. The data has a dropping trend.
The average number of fatalities per 1,000 fires is 5. This indicator was the highest - 49 in 2002, and the lowest 0 in 2007. The trend for deaths per 1,000 incidents is declining. Compared to the state value the number of deaths per 1,000 fires is higher.
Based on the data from the years 2002 - 2018 the average number of fire-related yearly deaths is 1. The highest number of deaths - 3 took place in 2002, and the lowest - 0 in 2007. The data has a dropping trend.
The average number of fatalities per 1,000 fires is 5. This indicator was the highest - 49 in 2002, and the lowest 0 in 2007. The trend for deaths per 1,000 incidents is declining. Compared to the state value the number of deaths per 1,000 fires is higher.Deaths per 1,000 incidents in Enid, OK compared to nearest cities:
(Note: Based on data for all years, including only cities with at least 2,500 fire incidents)
| Enid: | 3.1 |
| Guthrie: | 1.8 |
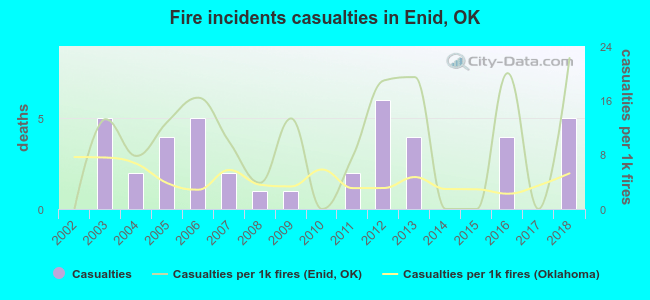 Based on the reports from the years 2002 - 2018 the average number of fire-related yearly casualties is 2. The highest number of reported injuries - 6 took place in 2012, and the lowest - 0 in 2002. The data has a rising trend.
The average number of casualties per 1,000 fire incidents is 10. This indicator was the highest - 22 in 2018, and the lowest 0 in 2002. The trend for injuries per 1,000 fires is growing. Compared to the Oklahoma value the number of casualties per 1,000 fires is much higher.
Based on the reports from the years 2002 - 2018 the average number of fire-related yearly casualties is 2. The highest number of reported injuries - 6 took place in 2012, and the lowest - 0 in 2002. The data has a rising trend.
The average number of casualties per 1,000 fire incidents is 10. This indicator was the highest - 22 in 2018, and the lowest 0 in 2002. The trend for injuries per 1,000 fires is growing. Compared to the Oklahoma value the number of casualties per 1,000 fires is much higher.
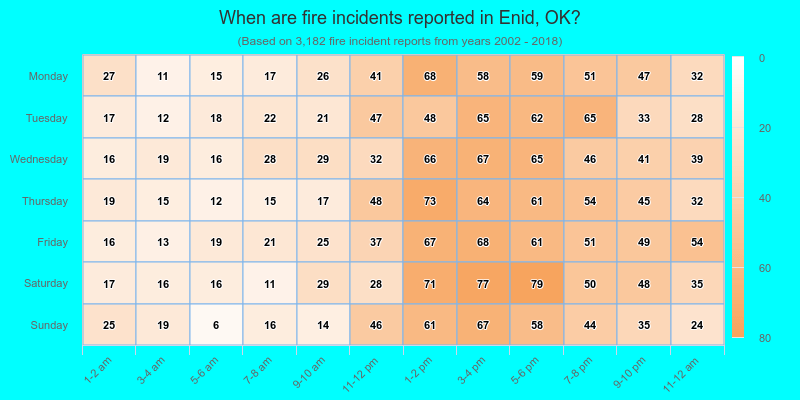
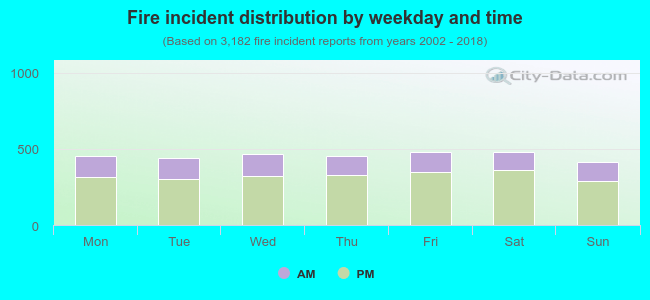 28.7% incidents where reported in the morning and 71.3% in the evening. The most fires (15.1%) took place on Friday, and the least (13.0%) on Sunday.
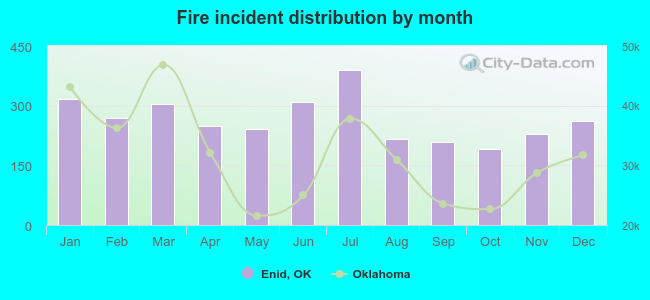 Based on the 3,182 reports from years 2002 - 2018 most fires (12.2%) took place during July, and the least (6.0%) in October.
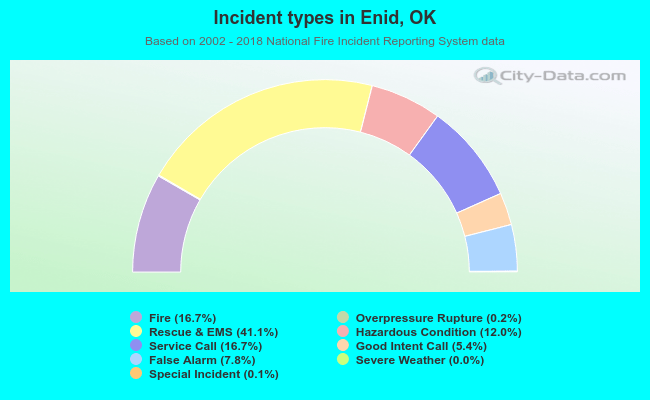 Out of all 19,102 cases reported during the years 2002 - 2018, the most belonged to the categories: Rescue & EMS (41.1%), Service Call (16.7%), and Fire (16.7%).
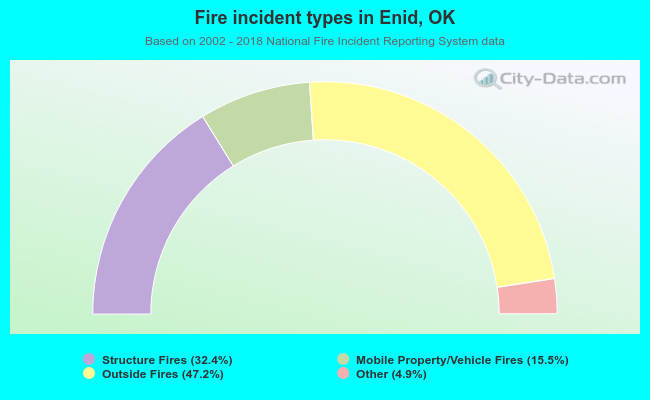 When looking into fire subcategories, the most incidents belonged to: Outside Fires (47.2%), and Structure Fires (32.4%).