Englewood: Fire Incidents, Colorado (CO)
Where are fire incidents reported in Englewood, CO
Something went wrong! Please refresh the page.
| Fire incidents reported | |
|---|---|
| Sreet name | Count |
| BROADWAY ST | 140 |
| BELLEVIEW AVE | 106 |
| LOGAN ST | 96 |
| ARAPAHOE RD | 84 |
| DELAWARE ST | 82 |
| HAMPDEN AVE | 78 |
| ACOMA ST | 76 |
| BANNOCK ST | 76 |
| DAYTON ST | 72 |
| LINCOLN ST | 66 |
| ELATI ST | 62 |
| DARTMOUTH AVE | 58 |
| FOX ST | 54 |
| PEORIA ST | 54 |
| SANTA FE DR | 52 |
| SHERMAN ST | 52 |
| YOSEMITE ST | 50 |
| BLACKHAWK ST | 48 |
| ENGLEWOOD PKY | 48 |
| GIRARD PL | 48 |
| BROADWAY | 44 |
| DRY CREEK RD | 44 |
| GRANT ST | 44 |
| PEAKVIEW AVE | 44 |
| PEARL ST | 44 |
| UNION AVE | 44 |
| WASHINGTON ST | 44 |
| CHEROKEE ST | 42 |
| FEDERAL BLVD | 42 |
| CLARKSON ST | 40 |
| Other | 552 |
2002 - 2018 National Fire Incident Reporting System (NFIRS) incidents
- Incident types reported to NFIRS in Englewood, CO
- 24,33355.9%Rescue & EMS
- 5,24012.0%False Alarm
- 4,96511.4%Hazardous Condition
- 3,5048.1%Good Intent Call
- 3,0116.9%Service Call
- 2,3865.5%Fire
- Fire incident types reported to NFIRS in Englewood, CO
- 90738.0%Structure Fires
- 89337.4%Outside Fires
- 46819.6%Mobile Property/Vehicle Fires
- 1184.9%Other
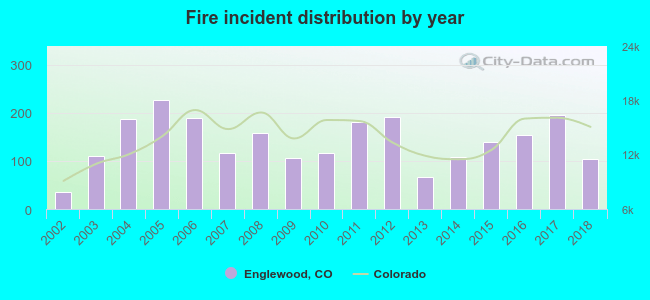 According to the data from the years 2002 - 2018 the average number of fires per year is 140. The highest number of reported fire incidents - 226 took place in 2005, and the least - 35 in 2002. The data has a growing trend.
The average number of yearly fire incidents per 10k residents in Englewood, CO compared to nearest cities:
(Note: Based on data for the last 3 years, including only cities with population 5,000 and above)
| Englewood: | 46.5 |
| Sheridan: | 45.9 |
| Cherry Hills Village: | 13.5 |
| Littleton: | 45.4 |
| Greenwood Village: | 12.1 |
| Glendale: | 18.9 |
| Denver: | 25.0 |
| Highlands Ranch: | 5.0 |
| Lakewood: | 24.8 |
 The median response time based on all reported fire incidents is 6 minutes. This is about the same as the Colorado median value.
The median response time in Englewood, CO compared to nearest cities:
(Note: Based on data for all years, including only cities with at least 500 fire incidents)
| Englewood: | 6 minutes |
| Sheridan: | 4 minutes |
| Littleton: | 7 minutes |
| Denver: | 4 minutes |
| Highlands Ranch: | 7 minutes |
| Lakewood: | 5 minutes |
| Centennial: | 6 minutes |
| Lone Tree: | 6 minutes |
| Wheat Ridge: | 5 minutes |
 According to the data from the years 2002 - 2018 the average number of fire-related fatalities per year is 0. The highest number of reported deaths - 1 took place in 2004, and the lowest - 0 in 2002. The data has a growing trend.
 Based on the reports from the years 2002 - 2018 the average number of fire-related yearly casualties is 1. The highest number of reported casualties - 4 took place in 2007, and the lowest - 0 in 2002. The data has an increasing trend.
The average number of injuries per 1,000 fire incidents is 10. This indicator was the highest - 34 in 2007, and the lowest 0 in 2002. The trend for injuries per 1,000 incidents is growing. Compared to the Colorado value the number of injuries per 1,000 incidents is lower.
Based on the reports from the years 2002 - 2018 the average number of fire-related yearly casualties is 1. The highest number of reported casualties - 4 took place in 2007, and the lowest - 0 in 2002. The data has an increasing trend.
The average number of injuries per 1,000 fire incidents is 10. This indicator was the highest - 34 in 2007, and the lowest 0 in 2002. The trend for injuries per 1,000 incidents is growing. Compared to the Colorado value the number of injuries per 1,000 incidents is lower.Casualties per 1,000 incidents in Englewood, CO compared to nearest cities:
(Note: Based on data for all years, including only cities with at least 500 fire incidents)
| Englewood: | 10.1 |
| Sheridan: | 17.1 |
| Littleton: | 19.8 |
| Denver: | 20.6 |
| Highlands Ranch: | 15.8 |
| Lakewood: | 36.1 |
| Centennial: | 32.4 |
| Lone Tree: | 6.9 |
| Wheat Ridge: | 9.2 |
 33.2% incidents where reported in the morning and 66.8% in the evening. The most fires (14.9%) took place on Tuesday, and the least (13.7%) on Wednesday.
 According to the 2,386 fire incident reports from years 2002 - 2018 most fires (11.8%) took place during July, and the least (5.7%) in January.
 Out of all 43,504 cases reported during the years 2002 - 2018, the most belonged to the categories: Rescue & EMS (55.9%), False Alarm (12.0%), and Hazardous Condition (11.4%).
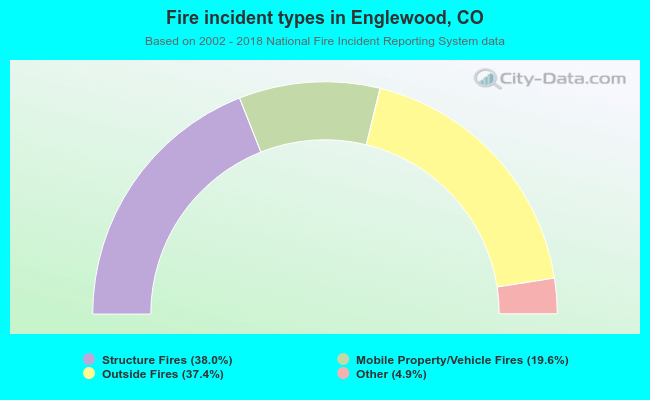 When looking into fire subcategories, the most reports belonged to: Structure Fires (38.0%), and Outside Fires (37.4%).