Elkridge: Fire Incidents, Maryland (MD)
Where are fire incidents reported in Elkridge, MD
Something went wrong! Please refresh the page.
| Fire incidents reported | |
|---|---|
| Sreet name | Count |
| WASHINGTON BLVD | 344 |
| MONTGOMERY RD | 144 |
| OLD WATERLOO RD | 120 |
| DUCKETTS LN | 98 |
| DORSEY RUN RD | 82 |
| OLD WASHINGTON RD | 64 |
| WASHINGTON BLVD -- | 64 |
| BROOKDALE DR | 52 |
| GREEN FIELD RD | 46 |
| WASHINGTON BLVD | 42 |
| DEEP RUN PKWY | 40 |
| MARSHALEE DR | 36 |
| LANDING RD | 32 |
| TROY HILL DR | 32 |
| GATEWAY OVERLOOK DR | 30 |
| MAIN ST | 30 |
| ROWANBERRY DR | 30 |
| DORSEY RD | 26 |
| ORCHARD CLUB DR | 24 |
| RED BARN WAY | 24 |
| HUNT CLUB RD | 22 |
| LOUDON AVE | 22 |
| RACE RD | 22 |
| RT 95 | 22 |
| SANTA BARBARA CT | 22 |
| FURNACE AVE | 20 |
| KIT KAT RD | 20 |
| RT 95 SB | 20 |
| SETTER DR | 20 |
| RT 95 NB | 18 |
| Other | 1 |
2002 - 2018 National Fire Incident Reporting System (NFIRS) incidents
- Incident types reported to NFIRS in Elkridge, MD
- 11,92461.7%Rescue & EMS
- 2,28711.8%Good Intent Call
- 1,7759.2%Hazardous Condition
- 1,5698.1%Fire
- 1,0265.3%False Alarm
- 6933.6%Service Call
- 220.1%Special Incident
- Fire incident types reported to NFIRS in Elkridge, MD
- 63940.7%Outside Fires
- 50832.4%Structure Fires
- 39425.1%Mobile Property/Vehicle Fires
- 281.8%Other
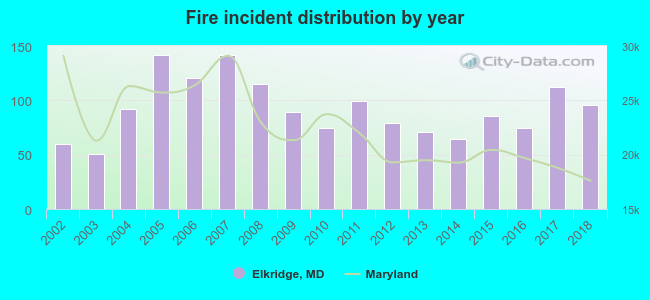 According to the data from the years 2002 - 2018 the average number of fire incidents per year is 92. The highest number of reported fires - 142 took place in 2005, and the least - 51 in 2003. The data has a growing trend.
The average number of yearly fire incidents per 10k residents in Elkridge, MD compared to nearest cities:
(Note: Based on data for the last 3 years, including only cities with population 5,000 and above)
| Elkridge: | 60.5 |
| Arbutus: | 19.4 |
| Jessup: | 52.3 |
| Linthicum: | 31.6 |
| Catonsville: | 21.1 |
| Lansdowne: | 2.4 |
| Severn: | 16.1 |
| Columbia: | 18.9 |
| Savage: | 11.8 |
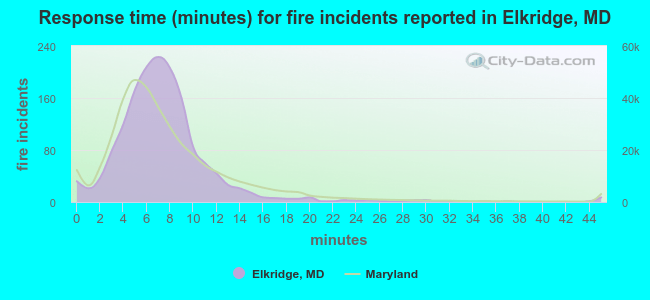 The median response time based on all reported fire incidents is 7 minutes. This is about the same as the state median value.
The median response time in Elkridge, MD compared to nearest cities:
(Note: Based on data for all years, including only cities with at least 500 fire incidents)
| Elkridge: | 7 minutes |
| Arbutus: | 5 minutes |
| Jessup: | 7 minutes |
| Catonsville: | 5 minutes |
| Severn: | 7 minutes |
| Columbia: | 6 minutes |
| Ellicott City: | 7 minutes |
| Glen Burnie: | 6 minutes |
| Laurel: | 7 minutes |
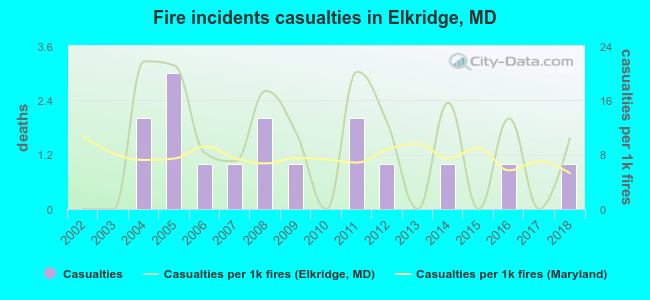 Based on the data from the years 2002 - 2018 the average number of fire-related casualties per year is 1. The highest number of casualties - 3 took place in 2005, and the lowest - 0 in 2002. The data has an increasing trend.
The average number of casualties per 1,000 fires is 9. This indicator was the highest - 22 in 2004, and the lowest 0 in 2002. The trend for injuries per 1,000 fires is growing. Compared to the Maryland value the number of casualties per 1,000 fires is higher.
Based on the data from the years 2002 - 2018 the average number of fire-related casualties per year is 1. The highest number of casualties - 3 took place in 2005, and the lowest - 0 in 2002. The data has an increasing trend.
The average number of casualties per 1,000 fires is 9. This indicator was the highest - 22 in 2004, and the lowest 0 in 2002. The trend for injuries per 1,000 fires is growing. Compared to the Maryland value the number of casualties per 1,000 fires is higher.Casualties per 1,000 incidents in Elkridge, MD compared to nearest cities:
(Note: Based on data for all years, including only cities with at least 500 fire incidents)
| Elkridge: | 10.2 |
| Arbutus: | 1.5 |
| Jessup: | 8.5 |
| Catonsville: | 3.5 |
| Severn: | 20.7 |
| Columbia: | 18.9 |
| Ellicott City: | 15.5 |
| Glen Burnie: | 14.1 |
| Laurel: | 14.5 |
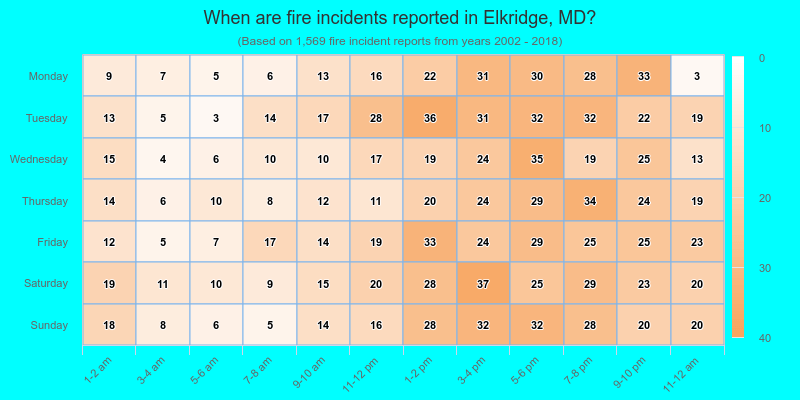
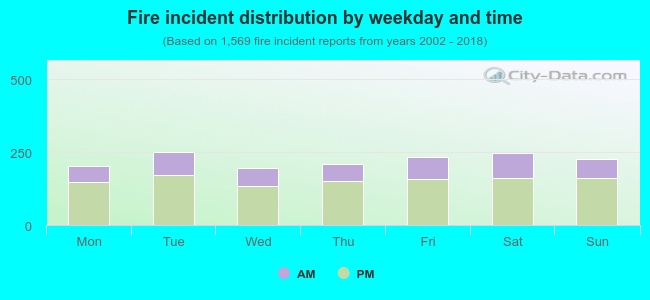 30.8% incidents where reported in the morning and 69.2% in the evening. The most fires (16.1%) took place on Tuesday, and the least (12.6%) on Wednesday.
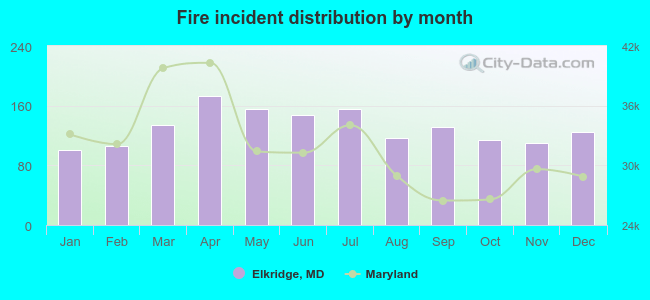 According to the 1,569 fire incidents from years 2002 - 2018 most fires (11.0%) took place during April, and the least (6.4%) in January.
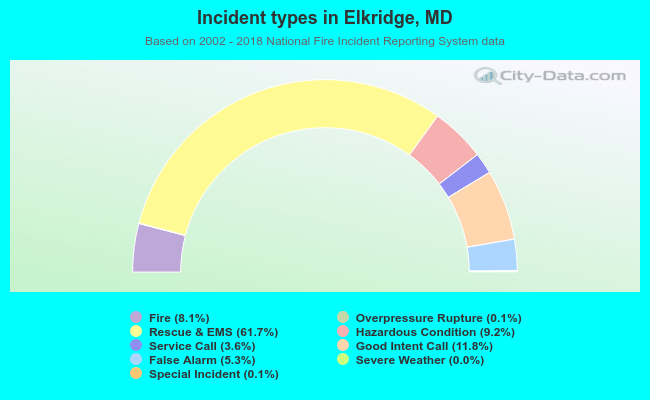 Out of all 19,322 cases reported during the years 2002 - 2018, the most belonged to the categories: Rescue & EMS (61.7%), Good Intent Call (11.8%), and Hazardous Condition (9.2%).
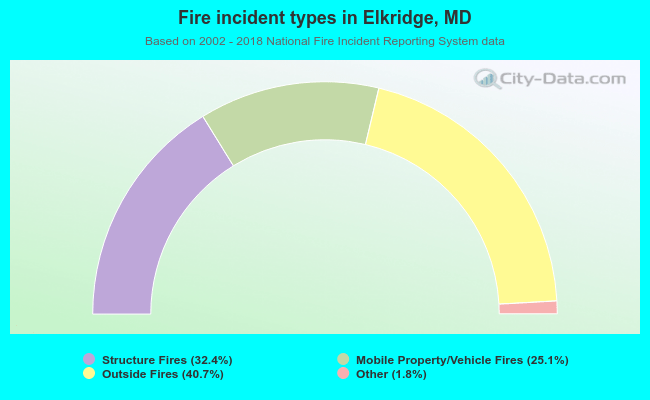 When looking into fire subcategories, the most incidents belonged to: Outside Fires (40.7%), and Structure Fires (32.4%).