Elk City: Fire Incidents, Oklahoma (OK)
Where are fire incidents reported in Elk City, OK
Something went wrong! Please refresh the page.
| Fire incidents reported | |
|---|---|
| Sreet name | Count |
| 3RD ST | 150 |
| MAIN ST | 94 |
| 7TH ST | 92 |
| 2ND ST | 52 |
| 6TH ST | 52 |
| WASHINGTON AVE | 52 |
| 1ST ST | 40 |
| RANDALL AVE | 40 |
| COUNTRY CLUB BLVD | 38 |
| ADAMS | 36 |
| VAN BUREN AVE | 36 |
| 20TH ST | 34 |
| 5TH ST | 34 |
| BROADWAY AVE | 32 |
| HWY 66 | 32 |
| 9TH ST | 28 |
| WATKINS AVE | 28 |
| 7TH ST PL | 26 |
| AVE B | 26 |
| BROADWAY | 24 |
| RIDGECREST RD | 24 |
| I40 | 22 |
| PIONEER RD | 22 |
| 10TH ST | 20 |
| 8TH ST | 20 |
| HOOVER CIR | 20 |
| OLIVER AVE | 20 |
| EASTERN AVE | 18 |
| ELK AVE | 18 |
| JEFFERSON AVE | 18 |
| Other | 902 |
2002 - 2018 National Fire Incident Reporting System (NFIRS) incidents
- Incident types reported to NFIRS in Elk City, OK
- 2,05050.7%Fire
- 90722.4%Hazardous Condition
- 42110.4%Good Intent Call
- 3659.0%Rescue & EMS
- 1463.6%Service Call
- 1283.2%False Alarm
- 130.3%Special Incident
- 80.2%Overpressure Rupture
- 60.1%Severe Weather
- Fire incident types reported to NFIRS in Elk City, OK
- 1,29163.0%Outside Fires
- 41020.0%Structure Fires
- 23711.6%Mobile Property/Vehicle Fires
- 1125.5%Other
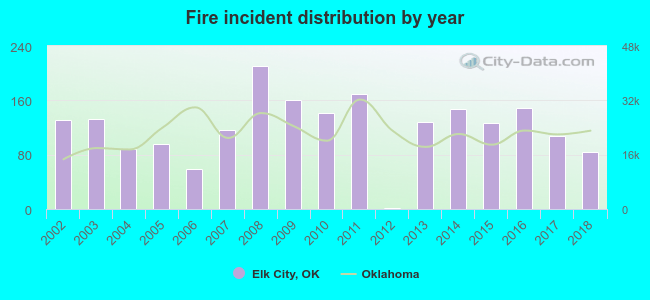 Based on the data from the years 2002 - 2018 the average number of fire incidents per year is 121. The highest number of fire incidents - 211 took place in 2008, and the least - 1 in 2012. The data has a decreasing trend.
The average number of yearly fire incidents per 10k residents in Elk City, OK compared to nearest cities:
(Note: Based on data for the last 3 years, including only cities with population 5,000 and above)
| Elk City: | 89.6 |
| Clinton: | 123.1 |
| Weatherford: | 81.5 |
| Altus: | 75.8 |
 The median response time based on all reported fire incidents is 5 minutes. This is lower than the state median value.
 Based on the data from the years 2002 - 2018 the average number of fire-related yearly casualties is 1. The highest number of casualties - 6 took place in 2013, and the lowest - 0 in 2002. The data has a constant trend.
The average number of casualties per 1,000 fires is 6. This indicator was the highest - 47 in 2013, and the lowest 0 in 2002. The trend for injuries per 1,000 incidents is constant. Compared to the state value the number of casualties per 1,000 incidents is higher.
Based on the data from the years 2002 - 2018 the average number of fire-related yearly casualties is 1. The highest number of casualties - 6 took place in 2013, and the lowest - 0 in 2002. The data has a constant trend.
The average number of casualties per 1,000 fires is 6. This indicator was the highest - 47 in 2013, and the lowest 0 in 2002. The trend for injuries per 1,000 incidents is constant. Compared to the state value the number of casualties per 1,000 incidents is higher.
 24.6% incidents where reported in the morning and 75.4% in the evening. The most fires (14.7%) took place on Saturday, and the least (14.0%) on Sunday.
 Based on the 2,050 fires from years 2002 - 2018 most fires (12.3%) took place during July, and the least (5.1%) in September.
 Out of all 4,044 cases reported during the years 2002 - 2018, the most belonged to the categories: Fire (50.7%), Hazardous Condition (22.4%), and Good Intent Call (10.4%).
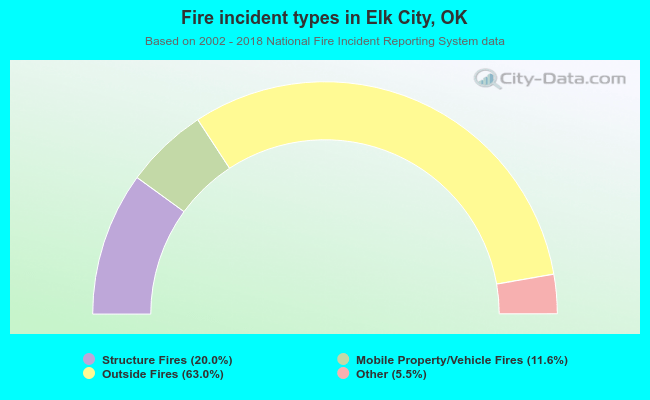 When looking into fire subcategories, the most reports belonged to: Outside Fires (63.0%), and Structure Fires (20.0%).