Eldorado at Santa Fe: Fire Incidents, New Mexico (NM)
Where are fire incidents reported in Eldorado at Santa Fe, NM
Something went wrong! Please refresh the page.
|
| |||||||||||||||||||||||||||||||||||||||||||||||||||||||||||||||||||||||||||||||||||||||||||||||||||||||||||||
2007 - 2018 National Fire Incident Reporting System (NFIRS) incidents
- Incident types reported to NFIRS in Eldorado at Santa Fe, NM
- 99863.6%Rescue & EMS
- 16910.8%Fire
- 1278.1%False Alarm
- 1127.1%Good Intent Call
- 1016.4%Hazardous Condition
- 603.8%Service Call
- 20.1%Special Incident
- Fire incident types reported to NFIRS in Eldorado at Santa Fe, NM
- 11467.5%Structure Fires
- 3118.3%Outside Fires
- 127.1%Mobile Property/Vehicle Fires
- 127.1%Other
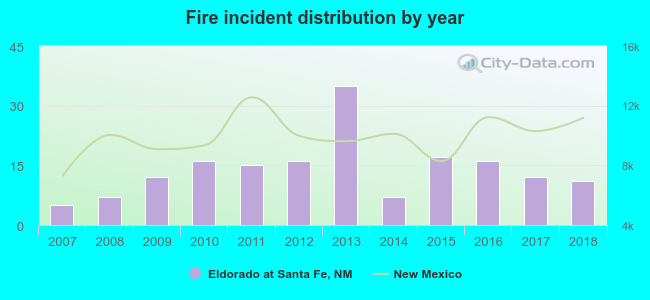 Based on the data from the years 2007 - 2018 the average number of fire incidents per year is 14. The highest number of fire incidents - 35 took place in 2013, and the least - 5 in 2007. The data has a growing trend.
The average number of yearly fire incidents per 10k residents in Eldorado at Santa Fe, NM compared to nearest cities:
(Note: Based on data for the last 3 years, including only cities with population 5,000 and above)
| Eldorado at Santa Fe: | 21.2 |
| Santa Fe: | 24.3 |
| White Rock: | 7.6 |
| Los Alamos: | 14.1 |
| Espanola: | 84.6 |
| San Juan Pueblo: | 1.5 |
| Bernalillo: | 39.3 |
| Las Vegas: | 85.3 |
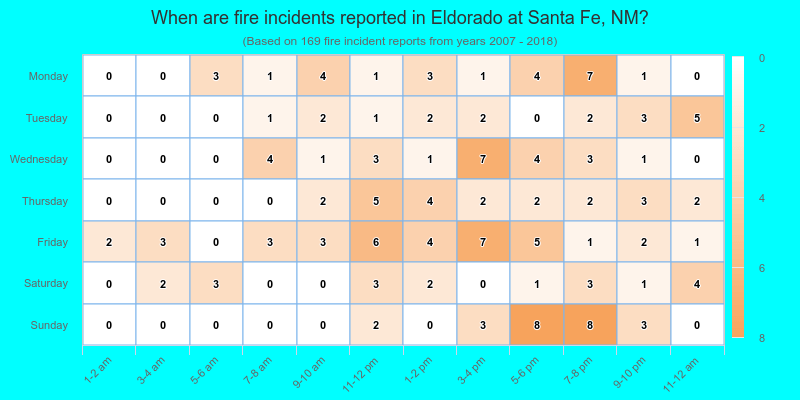
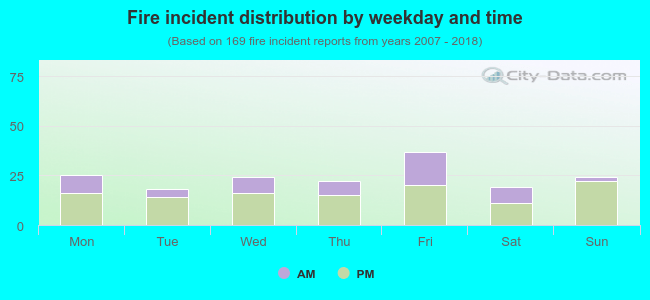 32.5% incidents where reported in the morning and 67.5% in the evening. The most fires (21.9%) took place on Friday, and the least (10.7%) on Tuesday.
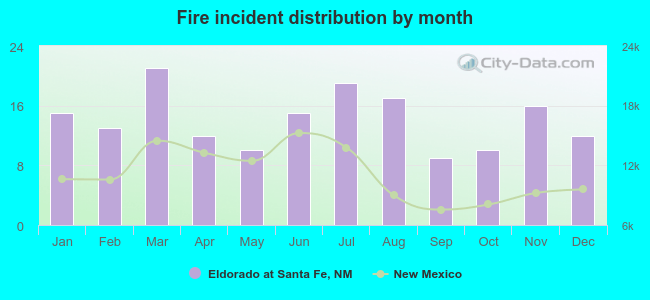 According to the 169 fire incidents from years 2007 - 2018 most fires (12.4%) took place during March, and the least (5.3%) in September.
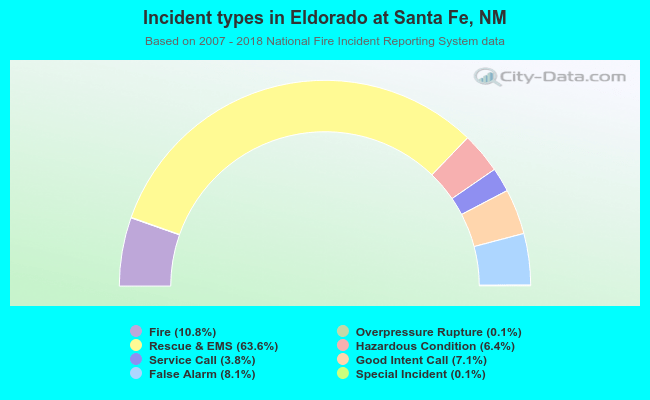 Out of all 1,570 cases reported during the years 2007 - 2018, the most belonged to the categories: Rescue & EMS (63.6%), Fire (10.8%), and False Alarm (8.1%).
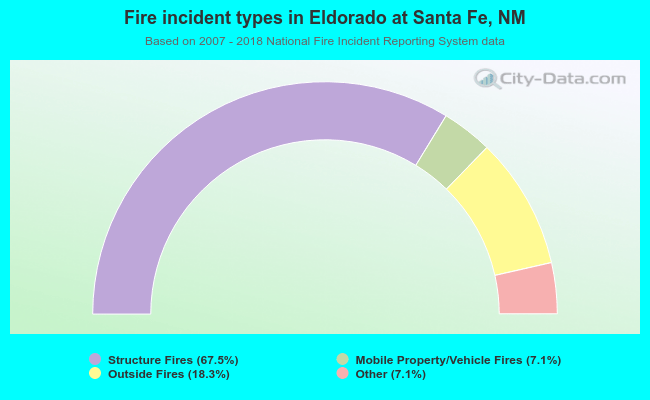 When looking into fire subcategories, the most incidents belonged to: Structure Fires (67.5%), and Outside Fires (18.3%).