Edwards: Fire Incidents, Colorado (CO)
Where are fire incidents reported in Edwards, CO
Something went wrong! Please refresh the page.
|
| |||||||||||||||||||||||||||||||||||||||||||||||||||||||||||||||||||||||||||||||||||||||||||||||||||||||||||||
2003 - 2018 National Fire Incident Reporting System (NFIRS) incidents
- Incident types reported to NFIRS in Edwards, CO
- 87332.5%Rescue & EMS
- 57821.5%False Alarm
- 52619.6%Good Intent Call
- 33312.4%Hazardous Condition
- 1897.0%Fire
- 1706.3%Service Call
- 90.3%Overpressure Rupture
- 50.2%Special Incident
- Fire incident types reported to NFIRS in Edwards, CO
- 8846.6%Outside Fires
- 7941.8%Structure Fires
- 168.5%Mobile Property/Vehicle Fires
- 63.2%Other
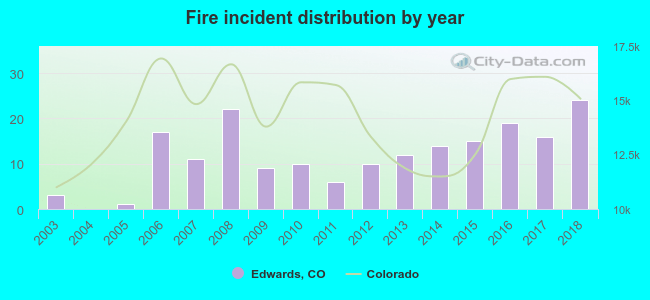 According to the data from the years 2003 - 2018 the average number of fire incidents per year is 12. The highest number of fire incidents - 24 took place in 2018, and the least - 0 in 2004. The data has a growing trend.
The average number of yearly fire incidents per 10k residents in Edwards, CO compared to nearest cities:
(Note: Based on data for the last 3 years, including only cities with population 5,000 and above)
| Edwards: | 19.2 |
| Avon: | 27.4 |
| Vail: | 78.2 |
| Eagle: | 29.9 |
| Gypsum: | 44.6 |
| Aspen: | 23.5 |
| Carbondale: | 44.6 |
| Glenwood Springs: | 27.4 |
| Steamboat Springs: | 33.4 |

 28.0% incidents where reported in the morning and 72.0% in the evening. The most fires (17.5%) took place on Thursday, and the least (11.1%) on Saturday.
 Based on the 189 fire incidents from years 2003 - 2018 most fires (16.9%) took place during June, and the least (4.2%) in November.
 Out of all 2,683 cases reported during the years 2003 - 2018, the most belonged to the categories: Rescue & EMS (32.5%), False Alarm (21.5%), and Good Intent Call (19.6%).
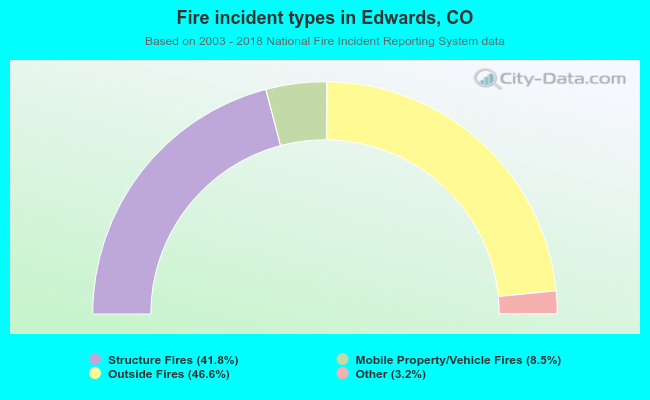 When looking into fire subcategories, the most reports belonged to: Outside Fires (46.6%), and Structure Fires (41.8%).