Eastlake: Fire Incidents, Ohio (OH)
Where are fire incidents reported in Eastlake, OH
Something went wrong! Please refresh the page.
| Fire incidents reported | |
|---|---|
| Sreet name | Count |
| LAKESHORE BLVD | 234 |
| VINE ST | 186 |
| CURTIS BLVD | 82 |
| LAKE SHORE BLVD | 60 |
| E 337 ST | 52 |
| ERIE RD | 50 |
| LAKELAND | 46 |
| LAKELAND BLVD | 46 |
| ROBERTS RD | 46 |
| STEVENS BLVD | 46 |
| ROUTE 91 HWY | 36 |
| E 332 ST | 32 |
| ST LAWRENCE BLVD | 28 |
| E 349 ST | 26 |
| E 348 ST | 24 |
| QUENTIN RD | 24 |
| ROUTE 91 | 24 |
| CURTIS | 22 |
| TRAYMORE | 22 |
| TRAYMORE BLVD | 22 |
| CENTER RD | 20 |
| GLEN DR | 20 |
| WAVERLY RD | 20 |
| BLANCHE AVE | 18 |
| E 345 ST | 18 |
| E 359 ST | 18 |
| LAKESHORE | 18 |
| PARKWAY DR | 18 |
| PAXTON RD | 18 |
| REEVES RD | 18 |
| Other | 1 |
2002 - 2018 National Fire Incident Reporting System (NFIRS) incidents
- Incident types reported to NFIRS in Eastlake, OH
- 8,97057.1%Rescue & EMS
- 2,24014.3%Hazardous Condition
- 2,04613.0%Service Call
- 1,2958.2%Fire
- 5653.6%False Alarm
- 5093.2%Good Intent Call
- 410.3%Severe Weather
- 240.2%Overpressure Rupture
- 220.1%Special Incident
- Fire incident types reported to NFIRS in Eastlake, OH
- 82363.6%Structure Fires
- 30823.8%Outside Fires
- 15712.1%Mobile Property/Vehicle Fires
- 70.5%Other
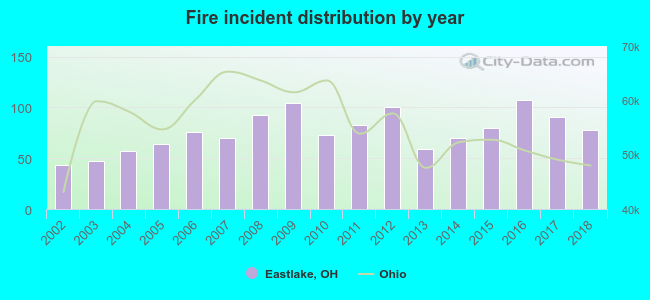 According to the data from the years 2002 - 2018 the average number of fires per year is 76. The highest number of fires - 107 took place in 2016, and the least - 43 in 2002. The data has a growing trend.
The average number of yearly fire incidents per 10k residents in Eastlake, OH compared to nearest cities:
(Note: Based on data for the last 3 years, including only cities with population 5,000 and above)
| Eastlake: | 50.2 |
| Willoughby: | 58.9 |
| Willowick: | 35.7 |
| Wickliffe: | 50.3 |
| Willoughby Hills: | 56.7 |
| Mentor: | 21.3 |
| Kirtland: | 63.1 |
| Euclid: | 44.4 |
| Highland Heights: | 34.7 |
 The median response time based on all reported fire incidents is 5 minutes. This is lower compared to the state median value.
The median response time in Eastlake, OH compared to nearest cities:
(Note: Based on data for all years, including only cities with at least 500 fire incidents)
| Eastlake: | 5 minutes |
| Willoughby: | 4 minutes |
| Willowick: | 4 minutes |
| Wickliffe: | 5 minutes |
| Willoughby Hills: | 7 minutes |
| Mentor: | 6 minutes |
| Kirtland: | 6 minutes |
| Euclid: | 5 minutes |
| Mayfield Heights: | 4 minutes |
 According to the data from the years 2002 - 2018 the average number of fire-related yearly deaths is 0. The highest number of reported deaths - 1 took place in 2008, and the lowest - 0 in 2002. The data has a constant trend.
 According to the data from the years 2002 - 2018 the average number of fire-related yearly casualties is 4. The highest number of reported injuries - 14 took place in 2011, and the lowest - 0 in 2003. The data has an increasing trend.
The average number of casualties per 1,000 fires is 55. This indicator was the highest - 169 in 2011, and the lowest 0 in 2003. The trend for casualties per 1,000 fires is decreasing. Compared to the state value the number of injuries per 1,000 fire incidents is much higher.
According to the data from the years 2002 - 2018 the average number of fire-related yearly casualties is 4. The highest number of reported injuries - 14 took place in 2011, and the lowest - 0 in 2003. The data has an increasing trend.
The average number of casualties per 1,000 fires is 55. This indicator was the highest - 169 in 2011, and the lowest 0 in 2003. The trend for casualties per 1,000 fires is decreasing. Compared to the state value the number of injuries per 1,000 fire incidents is much higher.Casualties per 1,000 incidents in Eastlake, OH compared to nearest cities:
(Note: Based on data for all years, including only cities with at least 500 fire incidents)
| Eastlake: | 55.6 |
| Willoughby: | 41.4 |
| Willowick: | 12.7 |
| Wickliffe: | 22.5 |
| Willoughby Hills: | 14.3 |
| Mentor: | 20.3 |
| Kirtland: | 3.4 |
| Euclid: | 15.5 |
| Mayfield Heights: | 5.3 |
 34.4% incidents where reported in the morning and 65.6% in the evening. The most fires (15.8%) took place on Tuesday, and the least (12.2%) on Wednesday.
 Based on the 1,295 fire incidents from years 2002 - 2018 most fires (11.8%) took place during July, and the least (5.2%) in February.
 Out of all 15,712 cases reported during the years 2002 - 2018, the most belonged to the categories: Rescue & EMS (57.1%), Hazardous Condition (14.3%), and Service Call (13.0%).
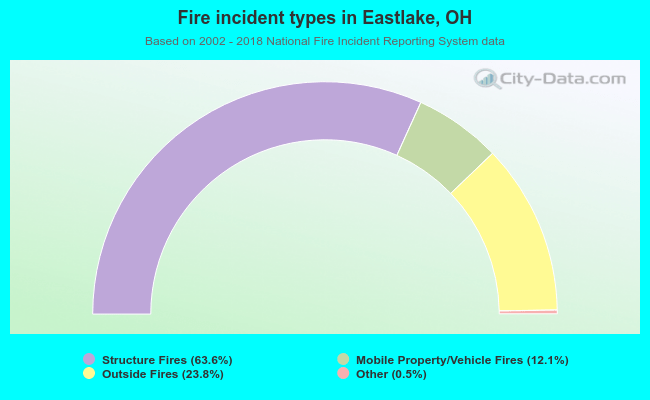 When looking into fire subcategories, the most incidents belonged to: Structure Fires (63.6%), and Outside Fires (23.8%).