Douglas: Fire Incidents, Georgia (GA)
Where are fire incidents reported in Douglas, GA
Something went wrong! Please refresh the page.
| Fire incidents reported | |
|---|---|
| Sreet name | Count |
| HIGHWAY 32 | 198 |
| BOWENS MILL RD | 140 |
| PETERSON AVE | 134 |
| HIGHWAY 221 | 108 |
| HIGHWAY 158 | 82 |
| BAKER HWY | 80 |
| HIGHWAY 441 | 76 |
| MADISON AVE | 74 |
| GASKIN AVE | 72 |
| NEW FOREST HWY | 70 |
| OLD AXSON HWY | 66 |
| WALKER ST | 52 |
| SINKHOLE RD | 46 |
| MAPLE ST | 38 |
| SPRING OAK ST | 38 |
| BRYAN ST | 36 |
| WILLICHOOCHEE HWY | 36 |
| HARVEY VICKERS RD | 34 |
| RAMBLEWOOD RD | 32 |
| WARD ST | 32 |
| KAMERA RD | 30 |
| MCNEAL DR | 30 |
| SAND HILL CHURCH RD | 30 |
| COLLEGE AVE | 26 |
| SUGARSAND RD | 26 |
| POPLAR ST | 24 |
| WENDELL SEARS RD | 24 |
| WILLACOOCHEE HWY | 24 |
| CROSS RD | 22 |
| DONNIE HARPER RD | 22 |
| Other | 813 |
2003 - 2018 National Fire Incident Reporting System (NFIRS) incidents
- Incident types reported to NFIRS in Douglas, GA
- 2,51539.9%Fire
- 1,16518.5%Hazardous Condition
- 91914.6%Good Intent Call
- 89314.2%Rescue & EMS
- 5318.4%False Alarm
- 2453.9%Service Call
- 220.3%Overpressure Rupture
- 70.1%Special Incident
- Fire incident types reported to NFIRS in Douglas, GA
- 1,34653.5%Outside Fires
- 70628.1%Structure Fires
- 43017.1%Mobile Property/Vehicle Fires
- 331.3%Other
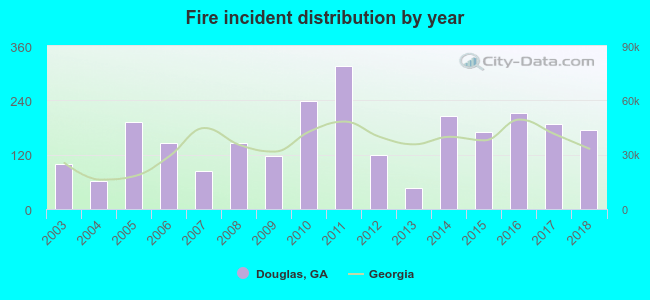 According to the data from the years 2003 - 2018 the average number of fire incidents per year is 157. The highest number of reported fire incidents - 316 took place in 2011, and the least - 47 in 2013. The data has a growing trend.
The average number of yearly fire incidents per 10k residents in Douglas, GA compared to nearest cities:
(Note: Based on data for the last 3 years, including only cities with population 5,000 and above)
| Douglas: | 164.0 |
| Fitzgerald: | 108.1 |
| Waycross: | 184.5 |
| McRae: | 11.2 |
| Tifton: | 107.4 |
| Adel: | 165.4 |
 The median response time based on all reported fire incidents is 6 minutes. This is comparable to the state median value.
The median response time in Douglas, GA compared to nearest cities:
(Note: Based on data for all years, including only cities with at least 500 fire incidents)
| Douglas: | 6 minutes |
| Alma: | 8 minutes |
| Fitzgerald: | 4 minutes |
| Hazlehurst: | 5 minutes |
| Nashville: | 6 minutes |
| Baxley: | 7 minutes |
| Waycross: | 8 minutes |
| Blackshear: | 7 minutes |
| McRae: | 6 minutes |
 26.1% incidents where reported in the morning and 73.9% in the evening. The most fires (17.7%) took place on Saturday, and the least (13.0%) on Wednesday.
 Based on the 2,515 fires from years 2003 - 2018 most fires (10.8%) took place during February, and the least (6.4%) in September.
 Out of all 6,300 cases reported during the years 2003 - 2018, the most belonged to the categories: Fire (39.9%), Hazardous Condition (18.5%), and Good Intent Call (14.6%).
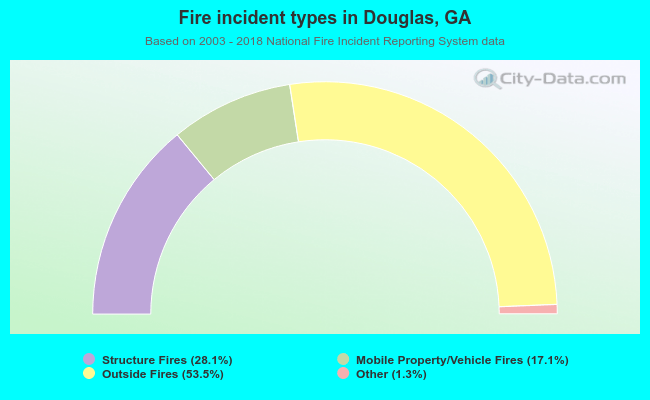 When looking into fire subcategories, the most reports belonged to: Outside Fires (53.5%), and Structure Fires (28.1%).