Deltona: Fire Incidents, Florida (FL)
Where are fire incidents reported in Deltona, FL
Something went wrong! Please refresh the page.
| Fire incidents reported | |
|---|---|
| Sreet name | Count |
| HOWLAND BLVD | 340 |
| INTERSTATE 4 | 322 |
| SAXON BLVD | 256 |
| PROVIDENCE BLVD | 224 |
| COURTLAND BLVD | 178 |
| ELKCAM BLVD | 178 |
| DELTONA BLVD | 140 |
| NORMANDY BLVD | 124 |
| DOYLE RD | 106 |
| FORT SMITH BLVD | 102 |
| SR 415 | 62 |
| NEWMARK DR | 56 |
| ENTERPRISE OSTEEN RD | 54 |
| I4 | 48 |
| WHITEWOOD DR | 48 |
| CAPTAIN DR | 40 |
| FOWLER DR | 40 |
| RIVERHEAD DR | 40 |
| CATALINA BLVD | 38 |
| CLOVERLEAF BLVD | 38 |
| TIVOLI DR | 38 |
| COVINGTON DR | 36 |
| ENTERPRISE RD | 36 |
| WELLINGTON DR | 36 |
| ADELIA BLVD | 34 |
| HAULOVER BLVD | 34 |
| BELLTOWER AVE | 32 |
| SEAGATE DR | 32 |
| SHERYL DR | 32 |
| ABAGAIL DR | 30 |
| Other | 2,148 |
2002 - 2018 National Fire Incident Reporting System (NFIRS) incidents
- Incident types reported to NFIRS in Deltona, FL
- 32,96361.2%Rescue & EMS
- 5,1199.5%Hazardous Condition
- 5,0889.5%Good Intent Call
- 4,9229.1%Fire
- 3,5336.6%Service Call
- 2,0223.8%False Alarm
- 930.2%Special Incident
- 590.1%Severe Weather
- Fire incident types reported to NFIRS in Deltona, FL
- 2,58252.5%Outside Fires
- 1,39328.3%Structure Fires
- 75015.2%Mobile Property/Vehicle Fires
- 1974.0%Other
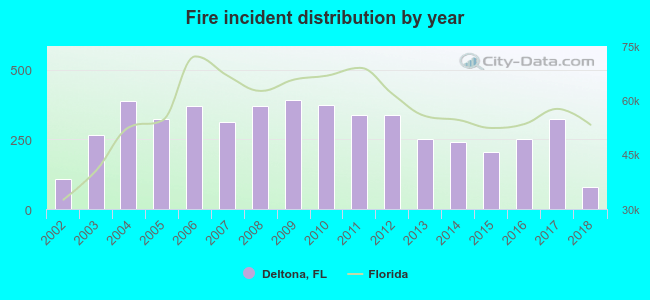 According to the data from the years 2002 - 2018 the average number of fires per year is 290. The highest number of fires - 390 took place in 2009, and the least - 80 in 2018. The data has a decreasing trend.
The average number of yearly fire incidents per 10k residents in Deltona, FL compared to nearest cities:
(Note: Based on data for the last 3 years, including only cities with population 5,000 and above)
| Deltona: | 25.0 |
| Orange City: | 114.3 |
| Sanford: | 49.8 |
| Lake Mary: | 18.4 |
| Winter Springs: | 11.3 |
| Longwood: | 38.7 |
| Oviedo: | 19.3 |
| Casselberry: | 16.5 |
| Edgewater: | 35.8 |
 The median response time based on all reported fire incidents is 6 minutes. This is comparable to the state median value.
The median response time in Deltona, FL compared to nearest cities:
(Note: Based on data for all years, including only cities with at least 500 fire incidents)
| Deltona: | 6 minutes |
| Orange City: | 5 minutes |
| Sanford: | 6 minutes |
| Lake Mary: | 6 minutes |
| Geneva: | 8 minutes |
| Winter Springs: | 5 minutes |
| Longwood: | 5 minutes |
| Oviedo: | 6 minutes |
| Casselberry: | 5 minutes |
 Based on the reports from the years 2002 - 2018 the average number of fire-related yearly casualties is 10. The highest number of reported injuries - 20 took place in 2004, and the lowest - 2 in 2016. The data has a dropping trend.
The average number of injuries per 1,000 fires is 33. This indicator was the highest - 66 in 2002, and the lowest 8 in 2016. The trend for injuries per 1,000 fires is declining. Compared to the state value the number of casualties per 1,000 fire incidents is much higher.
Based on the reports from the years 2002 - 2018 the average number of fire-related yearly casualties is 10. The highest number of reported injuries - 20 took place in 2004, and the lowest - 2 in 2016. The data has a dropping trend.
The average number of injuries per 1,000 fires is 33. This indicator was the highest - 66 in 2002, and the lowest 8 in 2016. The trend for injuries per 1,000 fires is declining. Compared to the state value the number of casualties per 1,000 fire incidents is much higher.Casualties per 1,000 incidents in Deltona, FL compared to nearest cities:
(Note: Based on data for all years, including only cities with at least 500 fire incidents)
| Deltona: | 33.1 |
| Orange City: | 11.2 |
| Sanford: | 13.4 |
| Lake Mary: | 20.7 |
| Geneva: | 20.3 |
| Winter Springs: | 36.7 |
| Longwood: | 29.7 |
| Oviedo: | 28.8 |
| Casselberry: | 20.4 |
 26.7% incidents where reported in the morning and 73.3% in the evening. The most fires (15.9%) took place on Saturday, and the least (12.7%) on Thursday.
 According to the 4,922 fires from years 2002 - 2018 most fires (11.5%) took place during March, and the least (5.4%) in August.
 Out of all 53,821 cases reported during the years 2002 - 2018, the most belonged to the categories: Rescue & EMS (61.2%), Hazardous Condition (9.5%), and Good Intent Call (9.5%).
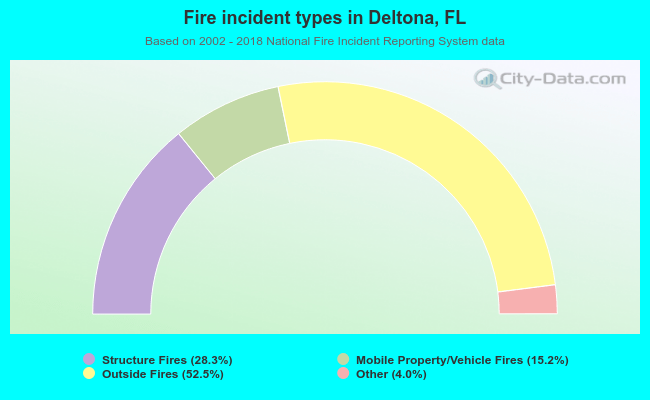 When looking into fire subcategories, the most incidents belonged to: Outside Fires (52.5%), and Structure Fires (28.3%).