Del City: Fire Incidents, Oklahoma (OK)
Where are fire incidents reported in Del City, OK
Something went wrong! Please refresh the page.
| Fire incidents reported | |
|---|---|
| Sreet name | Count |
| TINKER DIAGONAL | 222 |
| SUNNYLANE | 126 |
| BRYANT | 92 |
| 29 ST | 86 |
| SCOTT ST | 84 |
| VICKIE | 82 |
| 15 ST | 76 |
| 44 ST | 70 |
| SOONER RD | 68 |
| 29 | 66 |
| TINKER DIAGONAL ST | 64 |
| SUNNYLANE RD | 54 |
| BRYANT AVE | 48 |
| RENO | 48 |
| I-40 | 44 |
| DEL RD | 42 |
| MALLARD DR | 42 |
| RENO AVE | 40 |
| 10 ST | 36 |
| LEONHARDT DR | 36 |
| 24 ST | 34 |
| 23 ST | 32 |
| 15 | 28 |
| CHETWOOD DR | 26 |
| VFW DR | 26 |
| 4 ST | 24 |
| 44 | 24 |
| LAZY LN | 24 |
| 25 ST | 22 |
| 4 | 22 |
| Other | 116 |
2002 - 2018 National Fire Incident Reporting System (NFIRS) incidents
- Incident types reported to NFIRS in Del City, OK
- 13,31963.2%Rescue & EMS
- 2,14710.2%Service Call
- 1,8208.6%Hazardous Condition
- 1,8048.6%Fire
- 1,1125.3%Good Intent Call
- 8494.0%False Alarm
- Fire incident types reported to NFIRS in Del City, OK
- 69738.6%Outside Fires
- 65736.4%Structure Fires
- 37520.8%Mobile Property/Vehicle Fires
- 754.2%Other
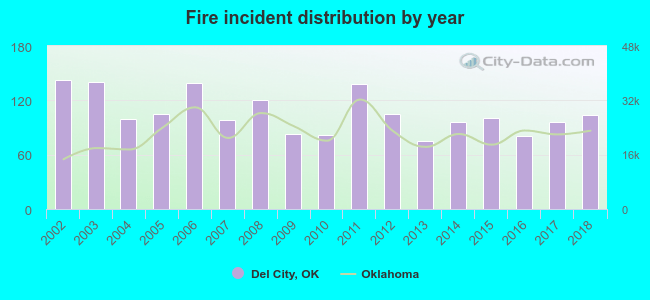 Based on the data from the years 2002 - 2018 the average number of fire incidents per year is 106. The highest number of fires - 143 took place in 2002, and the least - 75 in 2013. The data has a decreasing trend.
The average number of yearly fire incidents per 10k residents in Del City, OK compared to nearest cities:
(Note: Based on data for the last 3 years, including only cities with population 5,000 and above)
| Del City: | 42.6 |
| Midwest City: | 30.6 |
| Oklahoma City: | 37.3 |
| Moore: | 24.7 |
| Choctaw: | 100.3 |
| The Village: | 24.7 |
| Warr Acres: | 38.4 |
| Bethany: | 32.2 |
| Harrah: | 147.3 |
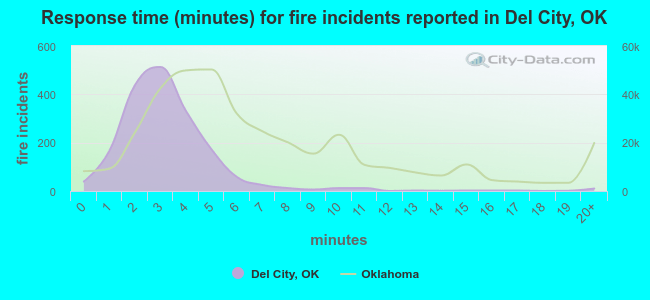 The median response time based on all reported fire incidents is 3 minutes. This is much lower compared to the state median value.
The median response time in Del City, OK compared to nearest cities:
(Note: Based on data for all years, including only cities with at least 500 fire incidents)
| Del City: | 3 minutes |
| Midwest City: | 5 minutes |
| Oklahoma City: | 5 minutes |
| Spencer: | 4 minutes |
| Moore: | 4 minutes |
| Choctaw: | 6 minutes |
| The Village: | 3 minutes |
| Warr Acres: | 3 minutes |
| Bethany: | 4 minutes |
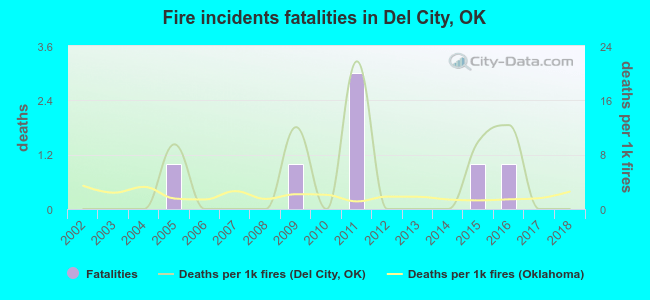 Based on the data from the years 2002 - 2018 the average number of fire-related yearly deaths is 0. The highest number of deaths - 3 took place in 2011, and the lowest - 0 in 2002. The data has a constant trend.
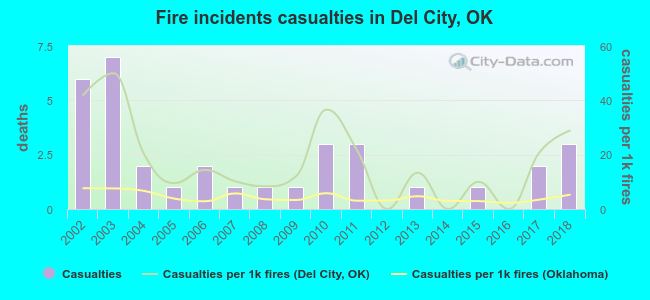 According to the data from the years 2002 - 2018 the average number of fire-related yearly casualties is 2. The highest number of reported injuries - 7 took place in 2003, and the lowest - 0 in 2012. The data has a declining trend.
The average number of casualties per 1,000 fire incidents is 18. This indicator was the highest - 50 in 2003, and the lowest 0 in 2012. The trend for casualties per 1,000 incidents is declining. Compared to the state value the number of injuries per 1,000 incidents is much higher.
According to the data from the years 2002 - 2018 the average number of fire-related yearly casualties is 2. The highest number of reported injuries - 7 took place in 2003, and the lowest - 0 in 2012. The data has a declining trend.
The average number of casualties per 1,000 fire incidents is 18. This indicator was the highest - 50 in 2003, and the lowest 0 in 2012. The trend for casualties per 1,000 incidents is declining. Compared to the state value the number of injuries per 1,000 incidents is much higher.Casualties per 1,000 incidents in Del City, OK compared to nearest cities:
(Note: Based on data for all years, including only cities with at least 500 fire incidents)
| Del City: | 18.8 |
| Midwest City: | 19.4 |
| Oklahoma City: | 10.7 |
| Spencer: | 0.8 |
| Moore: | 22.1 |
| Choctaw: | 2.6 |
| The Village: | 3.4 |
| Warr Acres: | 1.4 |
| Bethany: | 1.6 |
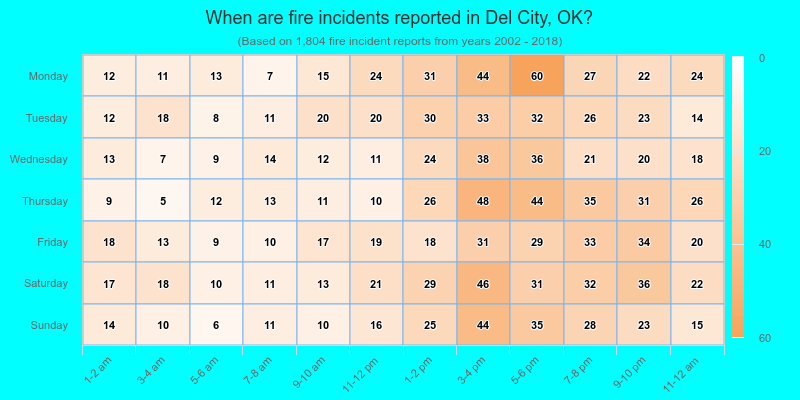
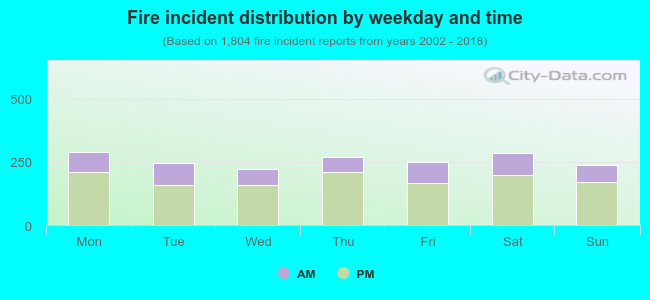 29.9% incidents where reported in the morning and 70.1% in the evening. The most fires (16.1%) took place on Monday, and the least (12.4%) on Wednesday.
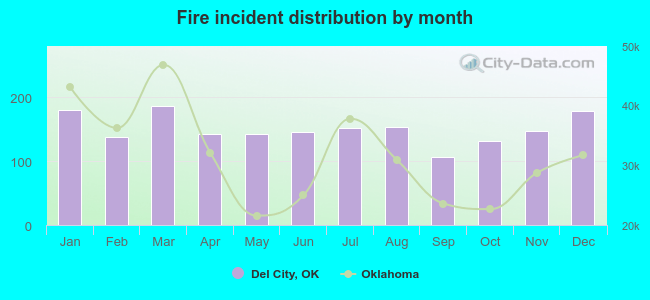 According to the 1,804 fires from years 2002 - 2018 most fires (10.4%) took place during March, and the least (5.9%) in September.
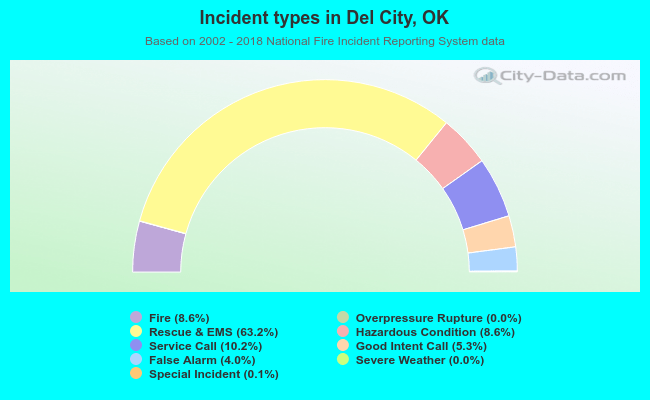 Out of all 21,088 cases reported during the years 2002 - 2018, the most belonged to the categories: Rescue & EMS (63.2%), Service Call (10.2%), and Hazardous Condition (8.6%).
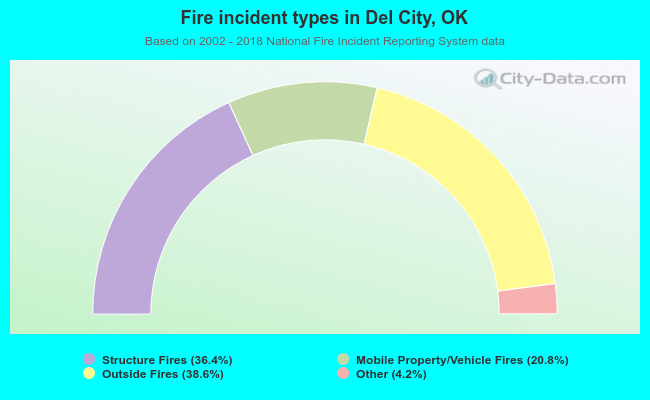 When looking into fire subcategories, the most reports belonged to: Outside Fires (38.6%), and Structure Fires (36.4%).