Decatur: Fire Incidents, Alabama (AL)
Where are fire incidents reported in Decatur, AL
Something went wrong! Please refresh the page.
| Fire incidents reported | |
|---|---|
| Sreet name | Count |
| BELTLINE RD | 449 |
| HIGHWAY 20 | 403 |
| HIGHWAY 31 | 298 |
| 06TH AVE | 231 |
| MODAUS RD | 189 |
| DANVILLE RD | 188 |
| OLD MOULTON RD | 168 |
| 05TH AVE | 149 |
| MOULTON ST | 123 |
| 10TH AVE | 111 |
| 6TH | 110 |
| SPRING AVE | 110 |
| 08TH AVE | 107 |
| MCENTIRE LN | 103 |
| 04TH AVE | 100 |
| KIRBY BRIDGE RD | 100 |
| 08TH ST | 94 |
| SUNSET DR | 86 |
| CENTRAL PKWY. | 85 |
| 11TH AVE | 82 |
| CHAPEL HILL RD | 81 |
| CENTRAL | 80 |
| POINT MALLARD PKWY. | 80 |
| I-65 | 76 |
| 14TH ST | 75 |
| I65 SB | 75 |
| 12TH AVE | 74 |
| COURTNEY DR | 72 |
| POINT MALLARD DR | 72 |
| WILSON ST | 71 |
2004 - 2018 National Fire Incident Reporting System (NFIRS) incidents
- Incident types reported to NFIRS in Decatur, AL
- 12,54963.2%Rescue & EMS
- 2,62413.2%Fire
- 1,5938.0%False Alarm
- 1,4187.1%Service Call
- 1,0795.4%Good Intent Call
- 4772.4%Hazardous Condition
- 820.4%Special Incident
- 250.1%Severe Weather
- Fire incident types reported to NFIRS in Decatur, AL
- 1,07140.8%Outside Fires
- 68426.1%Structure Fires
- 46217.6%Other
- 40715.5%Mobile Property/Vehicle Fires
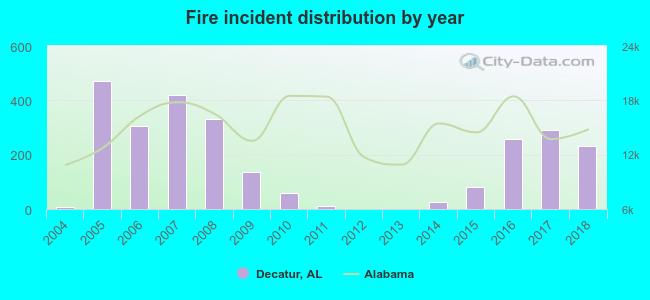 Based on the data from the years 2004 - 2018 the average number of fire incidents per year is 175. The highest number of fires - 470 took place in 2005, and the least - 0 in 2012. The data has a growing trend.
The average number of yearly fire incidents per 10k residents in Decatur, AL compared to nearest cities:
(Note: Based on data for the last 3 years, including only cities with population 5,000 and above)
| Decatur: | 46.8 |
| Hartselle: | 31.6 |
| Danville: | 1.6 |
| Athens: | 38.1 |
| Madison: | 15.0 |
| Harvest: | 30.9 |
| Vinemont: | 79.9 |
| Huntsville: | 42.6 |
| Cullman: | 83.0 |
 The median response time based on all reported fire incidents is 5 minutes. This is lower than the state median value.
The median response time in Decatur, AL compared to nearest cities:
(Note: Based on data for all years, including only cities with at least 500 fire incidents)
| Decatur: | 5 minutes |
| Hartselle: | 5 minutes |
| Athens: | 4 minutes |
| Madison: | 5 minutes |
| Moulton: | 9 minutes |
| Vinemont: | 8 minutes |
| Huntsville: | 5 minutes |
| Cullman: | 7 minutes |
| Arab: | 7 minutes |
 According to the reports from the years 2004 - 2018 the average number of fire-related casualties per year is 0. The highest number of reported injuries - 4 took place in 2005, and the lowest - 0 in 2004. The data has a constant trend.
The average number of casualties per 1,000 fires is 1. This indicator was the highest - 9 in 2005, and the lowest 0 in 2004. The trend for casualties per 1,000 fire incidents is constant. Compared to the Alabama value the number of casualties per 1,000 fire incidents is much lower.
According to the reports from the years 2004 - 2018 the average number of fire-related casualties per year is 0. The highest number of reported injuries - 4 took place in 2005, and the lowest - 0 in 2004. The data has a constant trend.
The average number of casualties per 1,000 fires is 1. This indicator was the highest - 9 in 2005, and the lowest 0 in 2004. The trend for casualties per 1,000 fire incidents is constant. Compared to the Alabama value the number of casualties per 1,000 fire incidents is much lower.
 33.8% incidents where reported in the morning and 66.2% in the evening. The most fires (17.1%) took place on Saturday, and the least (12.9%) on Tuesday.
 According to the 2,624 fire incidents from years 2004 - 2018 most fires (10.2%) took place during October, and the least (5.1%) in March.
 Out of all 19,858 cases reported during the years 2004 - 2018, the most belonged to the categories: Rescue & EMS (63.2%), Fire (13.2%), and False Alarm (8.0%).
 When looking into fire subcategories, the most incidents belonged to: Outside Fires (40.8%), and Structure Fires (26.1%).