Darby: Fire Incidents, Pennsylvania (PA)
Where are fire incidents reported in Darby, PA
Something went wrong! Please refresh the page.
|
| |||||||||||||||||||||||||||||||||||||||||||||||||||||||||||||||||||||||||||||||||||||||||||||||||||||||||||||
2003 - 2018 National Fire Incident Reporting System (NFIRS) incidents
- Incident types reported to NFIRS in Darby, PA
- 64133.1%Fire
- 35618.4%Good Intent Call
- 34117.6%Hazardous Condition
- 27514.2%False Alarm
- 22011.4%Rescue & EMS
- 824.2%Service Call
- 170.9%Special Incident
- 30.2%Overpressure Rupture
- Fire incident types reported to NFIRS in Darby, PA
- 51580.3%Structure Fires
- 629.7%Outside Fires
- 365.6%Mobile Property/Vehicle Fires
- 284.4%Other
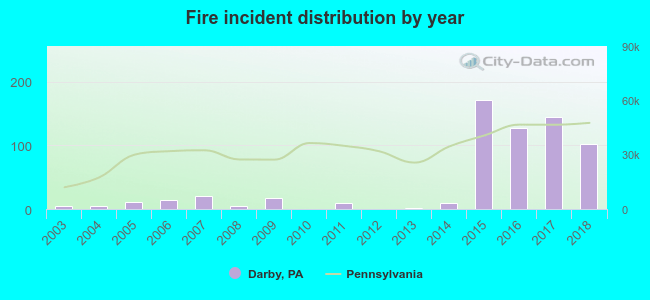 Based on the data from the years 2003 - 2018 the average number of fires per year is 40. The highest number of fire incidents - 171 took place in 2015, and the least - 0 in 2010. The data has a rising trend.
The average number of yearly fire incidents per 10k residents in Darby, PA compared to nearest cities:
(Note: Based on data for the last 3 years, including only cities with population 5,000 and above)
| Darby: | 116.6 |
| Sharon Hill: | 129.7 |
| Yeadon: | 98.3 |
| Collingdale: | 61.4 |
| Darby Township: | 6.2 |
| Lansdowne: | 63.3 |
| Folcroft: | 66.3 |
| Clifton Heights: | 46.0 |
| Glenolden: | 98.5 |
 The median response time based on all reported fire incidents is 5 minutes. This is lower than the Pennsylvania median value.
The median response time in Darby, PA compared to nearest cities:
(Note: Based on data for all years, including only cities with at least 500 fire incidents)
| Darby: | 5 minutes |
| Yeadon: | 5 minutes |
| Collingdale: | 4 minutes |
| Paulsboro: | 8 minutes |
| Broomall: | 6 minutes |
| Media: | 6 minutes |
| Gloucester City: | 4 minutes |
| Westville: | 6 minutes |
| Brookhaven: | 3 minutes |
 33.1% incidents where reported in the morning and 66.9% in the evening. The most fires (16.1%) took place on Thursday, and the least (12.0%) on Sunday.
 According to the 641 reports from years 2003 - 2018 most fires (11.4%) took place during February, and the least (5.3%) in November.
 Out of all 1,935 cases reported during the years 2003 - 2018, the most belonged to the categories: Fire (33.1%), Good Intent Call (18.4%), and Hazardous Condition (17.6%).
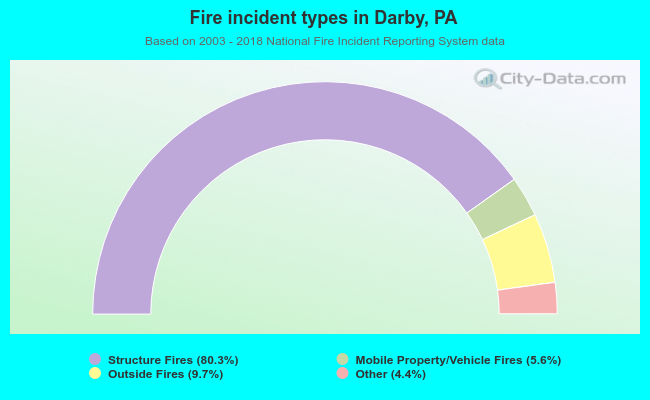 When looking into fire subcategories, the most reports belonged to: Structure Fires (80.3%), and Outside Fires (9.7%).