Crete: Fire Incidents, Nebraska (NE)
Where are fire incidents reported in Crete, NE
Something went wrong! Please refresh the page.
|
| |||||||||||||||||||||||||||||||||||||||||||||||||||||||||||||||||||||||||||||||||||||||||||||||||||||||||||||
2002 - 2018 National Fire Incident Reporting System (NFIRS) incidents
- Incident types reported to NFIRS in Crete, NE
- 71948.8%Rescue & EMS
- 45530.9%Fire
- 966.5%False Alarm
- 936.3%Good Intent Call
- 563.8%Service Call
- 422.9%Hazardous Condition
- 60.4%Severe Weather
- 30.2%Overpressure Rupture
- 30.2%Special Incident
- Fire incident types reported to NFIRS in Crete, NE
- 22048.4%Outside Fires
- 13529.7%Structure Fires
- 8518.7%Mobile Property/Vehicle Fires
- 153.3%Other
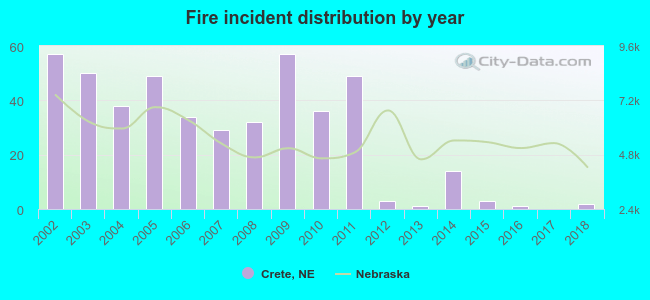 Based on the data from the years 2002 - 2018 the average number of fire incidents per year is 27. The highest number of reported fires - 57 took place in 2002, and the least - 0 in 2017. The data has a declining trend.

 Based on the data from the years 2002 - 2018 the average number of fire-related casualties per year is 1. The highest number of reported casualties - 6 took place in 2007, and the lowest - 0 in 2004. The data has a decreasing trend.
 31.0% incidents where reported in the morning and 69.0% in the evening. The most fires (17.6%) took place on Monday, and the least (11.6%) on Thursday.
 According to the 455 reports from years 2002 - 2018 most fires (11.9%) took place during March, and the least (4.8%) in February.
 Out of all 1,473 cases reported during the years 2002 - 2018, the most belonged to the categories: Rescue & EMS (48.8%), Fire (30.9%), and False Alarm (6.5%).
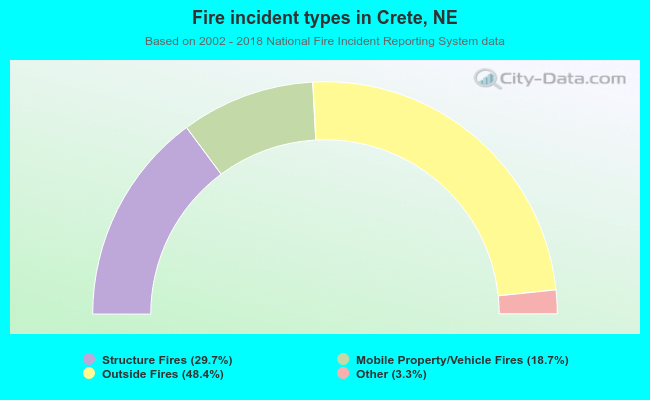 When looking into fire subcategories, the most reports belonged to: Outside Fires (48.4%), and Structure Fires (29.7%).