Cottage Grove: Fire Incidents, Oregon (OR)
Where are fire incidents reported in Cottage Grove, OR
Something went wrong! Please refresh the page.
|
| |||||||||||||||||||||||||||||||||||||||||||||||||||||||||||||||||||||||||||||||||||||||||||||||||||||||||||||
2002 - 2018 National Fire Incident Reporting System (NFIRS) incidents
- Incident types reported to NFIRS in Cottage Grove, OR
- 6,66081.0%Rescue & EMS
- 8019.7%Fire
- 3594.4%Good Intent Call
- 1622.0%Hazardous Condition
- 1211.5%False Alarm
- 1131.4%Service Call
- Fire incident types reported to NFIRS in Cottage Grove, OR
- 31239.0%Structure Fires
- 28535.6%Outside Fires
- 16620.7%Mobile Property/Vehicle Fires
- 384.7%Other
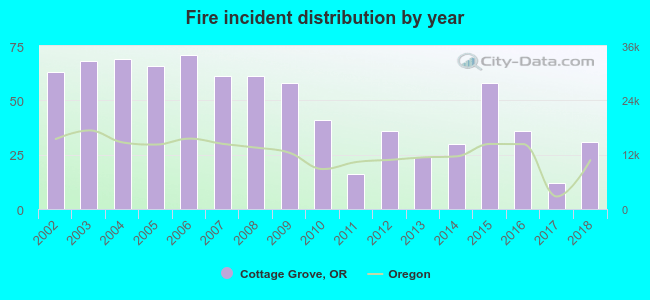 Based on the data from the years 2002 - 2018 the average number of fire incidents per year is 47. The highest number of fires - 71 took place in 2006, and the least - 12 in 2017. The data has a decreasing trend.
The average number of yearly fire incidents per 10k residents in Cottage Grove, OR compared to nearest cities:
(Note: Based on data for the last 3 years, including only cities with population 5,000 and above)
| Cottage Grove: | 26.7 |
| Creswell: | 24.8 |
| Pleasant Hill: | 45.9 |
| Springfield: | 18.4 |
| Eugene: | 24.4 |
| Junction City: | 44.4 |
| Sutherlin: | 33.9 |
| Roseburg North: | 16.9 |
| Roseburg: | 41.5 |
 The median response time based on all reported fire incidents is 6 minutes. This is about the same as the Oregon median value.
The median response time in Cottage Grove, OR compared to nearest cities:
(Note: Based on data for all years, including only cities with at least 500 fire incidents)
| Cottage Grove: | 6 minutes |
| Springfield: | 5 minutes |
| Eugene: | 6 minutes |
| Junction City: | 9 minutes |
| Sutherlin: | 6 minutes |
| Roseburg: | 6 minutes |
| Sweet Home: | 7 minutes |
| Lebanon: | 6 minutes |
| Florence: | 6 minutes |
 30.5% incidents where reported in the morning and 69.5% in the evening. The most fires (15.6%) took place on Thursday, and the least (12.6%) on Wednesday.
 According to the 801 reports from years 2002 - 2018 most fires (15.6%) took place during July, and the least (5.0%) in November.
 Out of all 8,225 cases reported during the years 2002 - 2018, the most belonged to the categories: Rescue & EMS (81.0%), Fire (9.7%), and Good Intent Call (4.4%).
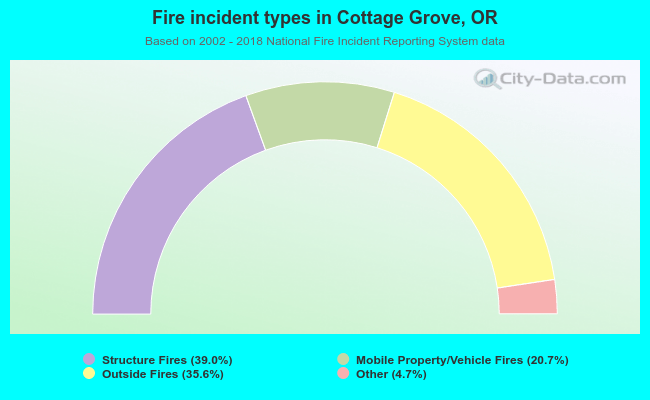 When looking into fire subcategories, the most incidents belonged to: Structure Fires (39.0%), and Outside Fires (35.6%).