Columbus: Fire Incidents, Mississippi (MS)
Where are fire incidents reported in Columbus, MS
Something went wrong! Please refresh the page.
| Fire incidents reported | |
|---|---|
| Sreet name | Count |
| LEHMBERG RD | 142 |
| HIGHWAY 45 HWY | 134 |
| MAIN ST | 126 |
| ALABAMA ST | 124 |
| MILITARY RD | 100 |
| HWY 182 | 76 |
| HWY 82 | 72 |
| COLLEGE ST | 64 |
| YORKVILLE RD | 62 |
| 22ND ST | 60 |
| WATERWORKS RD | 56 |
| HIGHWAY 373 | 52 |
| HWY 50 | 50 |
| JESS LYONS RD | 50 |
| HIGHWAY 45 | 48 |
| HWY 69 | 48 |
| 6TH AVE | 44 |
| FRISCO RD | 42 |
| HWY 45 | 42 |
| HIGHWAY 82 HWY | 40 |
| NASHVILLE FERRY RD | 38 |
| NEW HOPE RD | 38 |
| RIDGE RD | 38 |
| SAND RD | 38 |
| 10TH AVE | 36 |
| 16TH ST | 36 |
| 4TH AVE | 34 |
| BELL AVE | 34 |
| 17TH ST | 32 |
| TUSCALOOSA RD | 32 |
| Other | 2,617 |
2002 - 2018 National Fire Incident Reporting System (NFIRS) incidents
- Incident types reported to NFIRS in Columbus, MS
- 18,94863.8%Rescue & EMS
- 4,40514.8%Fire
- 1,9796.7%Good Intent Call
- 1,9656.6%False Alarm
- 1,5375.2%Hazardous Condition
- 4811.6%Service Call
- 2510.8%Special Incident
- 1380.5%Overpressure Rupture
- Fire incident types reported to NFIRS in Columbus, MS
- 1,72539.2%Outside Fires
- 1,52834.7%Structure Fires
- 76217.3%Mobile Property/Vehicle Fires
- 3908.9%Other
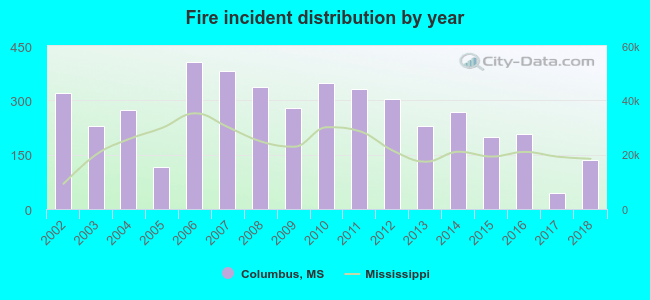 Based on the data from the years 2002 - 2018 the average number of fires per year is 259. The highest number of fires - 406 took place in 2006, and the least - 43 in 2017. The data has a declining trend.
The average number of yearly fire incidents per 10k residents in Columbus, MS compared to nearest cities:
(Note: Based on data for the last 3 years, including only cities with population 5,000 and above)
| Columbus: | 55.2 |
| West Point: | 91.0 |
| Starkville: | 64.8 |
| Aberdeen: | 182.3 |
| Amory: | 111.2 |
| Louisville: | 176.0 |
 The median response time based on all reported fire incidents is 5 minutes. This is lower compared to the state median value.
The median response time in Columbus, MS compared to nearest cities:
(Note: Based on data for all years, including only cities with at least 500 fire incidents)
| Columbus: | 5 minutes |
| West Point: | 4 minutes |
| Starkville: | 5 minutes |
| Aberdeen: | 3 minutes |
| Macon: | 6 minutes |
| Amory: | 5 minutes |
| Fayette: | 6 minutes |
| Okolona: | 7 minutes |
| Nettleton: | 9 minutes |
 According to the reports from the years 2002 - 2018 the average number of fire-related yearly deaths is 0. The highest number of deaths - 2 took place in 2009, and the lowest - 0 in 2002. The data has a growing trend.
The average number of fatalities per 1,000 fire incidents is 2. This indicator was the highest - 7 in 2018, and the lowest 0 in 2002. The trend for fatalities per 1,000 fires is increasing. Compared to the Mississippi value the number of fatalities per 1,000 incidents is lower.
According to the reports from the years 2002 - 2018 the average number of fire-related yearly deaths is 0. The highest number of deaths - 2 took place in 2009, and the lowest - 0 in 2002. The data has a growing trend.
The average number of fatalities per 1,000 fire incidents is 2. This indicator was the highest - 7 in 2018, and the lowest 0 in 2002. The trend for fatalities per 1,000 fires is increasing. Compared to the Mississippi value the number of fatalities per 1,000 incidents is lower.Deaths per 1,000 incidents in Columbus, MS compared to nearest cities:
(Note: Based on data for all years, including only cities with at least 2,500 fire incidents)
| Columbus: | 1.6 |
| Starkville: | 8.2 |
| Louisville: | 3.5 |
 Based on the data from the years 2002 - 2018 the average number of fire-related casualties per year is 0. The highest number of reported casualties - 3 took place in 2004, and the lowest - 0 in 2005. The data has a declining trend.
The average number of injuries per 1,000 fires is 1. This indicator was the highest - 11 in 2004, and the lowest 0 in 2005. The trend for injuries per 1,000 fires is declining. Compared to the Mississippi value the number of casualties per 1,000 fires is much lower.
Based on the data from the years 2002 - 2018 the average number of fire-related casualties per year is 0. The highest number of reported casualties - 3 took place in 2004, and the lowest - 0 in 2005. The data has a declining trend.
The average number of injuries per 1,000 fires is 1. This indicator was the highest - 11 in 2004, and the lowest 0 in 2005. The trend for injuries per 1,000 fires is declining. Compared to the Mississippi value the number of casualties per 1,000 fires is much lower.Casualties per 1,000 incidents in Columbus, MS compared to nearest cities:
(Note: Based on data for all years, including only cities with at least 500 fire incidents)
| Columbus: | 1.6 |
| West Point: | 1.9 |
| Starkville: | 2.7 |
| Aberdeen: | 0.0 |
| Macon: | 0.0 |
| Amory: | 1.8 |
| Fayette: | 1.3 |
| Okolona: | 0.0 |
| Nettleton: | 4.2 |
 31.4% incidents where reported in the morning and 68.6% in the evening. The most fires (15.2%) took place on Wednesday, and the least (13.6%) on Monday.
 According to the 4,405 fires from years 2002 - 2018 most fires (11.4%) took place during March, and the least (6.5%) in May.
 Out of all 29,719 cases reported during the years 2002 - 2018, the most belonged to the categories: Rescue & EMS (63.8%), Fire (14.8%), and Good Intent Call (6.7%).
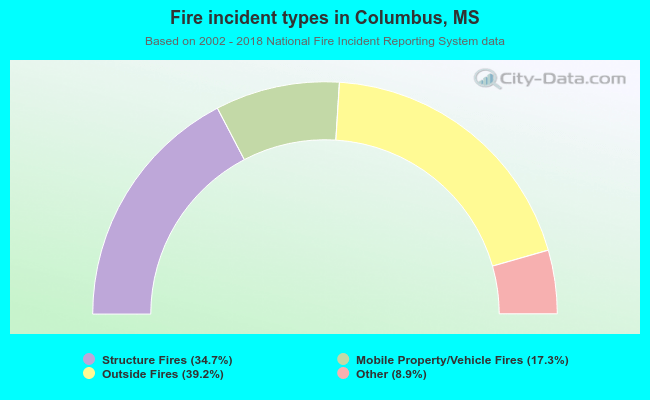 When looking into fire subcategories, the most incidents belonged to: Outside Fires (39.2%), and Structure Fires (34.7%).