Clinton: Fire Incidents, Iowa (IA)
Where are fire incidents reported in Clinton, IA
Something went wrong! Please refresh the page.
| Fire incidents reported | |
|---|---|
| Sreet name | Count |
| 6TH AVE | 162 |
| 4TH ST | 158 |
| 5TH AVE | 152 |
| 3RD ST | 130 |
| 2ND AVE | 122 |
| 2ND ST | 118 |
| LINCOLNWAY | 114 |
| 13TH AVE | 112 |
| 7TH AVE | 112 |
| BEAVER CHANNEL PKWY | 98 |
| 1ST AVE | 90 |
| 8TH AVE | 90 |
| PERSHING BLVD | 82 |
| 3RD AVE | 78 |
| MAIN AVE | 78 |
| 11TH AVE | 76 |
| 4TH AVE | 70 |
| BLUFF BLVD | 66 |
| CAMANCHE AVE | 66 |
| 10TH AVE | 64 |
| 5TH ST | 60 |
| ROOSEVELT ST | 58 |
| 14TH AVE | 54 |
| 9TH AVE | 52 |
| 12TH AVE | 48 |
| 15TH AVE | 48 |
| 6TH ST | 40 |
| 18TH ST | 38 |
| LIBERTY AVE | 34 |
| 7TH ST | 32 |
2002 - 2017 National Fire Incident Reporting System (NFIRS) incidents
- Incident types reported to NFIRS in Clinton, IA
- 12,99361.7%Rescue & EMS
- 2,51011.9%Service Call
- 2,0229.6%Fire
- 1,4947.1%Hazardous Condition
- 1,0124.8%False Alarm
- 9604.6%Good Intent Call
- 410.2%Overpressure Rupture
- 240.1%Special Incident
- Fire incident types reported to NFIRS in Clinton, IA
- 83641.3%Structure Fires
- 77638.4%Outside Fires
- 33516.6%Mobile Property/Vehicle Fires
- 753.7%Other
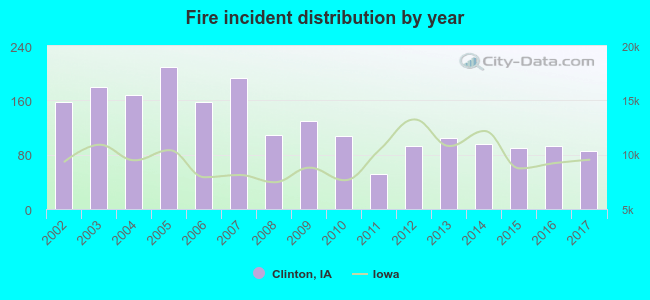 According to the data from the years 2002 - 2017 the average number of fires per year is 126. The highest number of reported fires - 209 took place in 2005, and the least - 51 in 2011. The data has a declining trend.
The average number of yearly fire incidents per 10k residents in Clinton, IA compared to nearest cities:
(Note: Based on data for the last 3 years, including only cities with population 5,000 and above)
| Clinton: | 33.9 |
| De Witt: | 6.7 |
| Eldridge: | 41.4 |
| Bettendorf: | 8.8 |
| Maquoketa: | 31.0 |
| Davenport: | 9.2 |
 The median response time based on all reported fire incidents is 5 minutes. This is lower compared to the Iowa median value.
The median response time in Clinton, IA compared to nearest cities:
(Note: Based on data for all years, including only cities with at least 500 fire incidents)
| Clinton: | 5 minutes |
| Morrison: | 7 minutes |
| Savanna: | 8 minutes |
| Bettendorf: | 5 minutes |
| East Moline: | 5 minutes |
| Colona: | 6 minutes |
| Sterling: | 8 minutes |
| Rock Falls: | 7 minutes |
| Geneseo: | 8 minutes |
 According to the reports from the years 2002 - 2017 the average number of fire-related yearly deaths is 1. The highest number of deaths - 5 took place in 2010, and the lowest - 0 in 2003. The data has a constant trend.
 According to the data from the years 2002 - 2017 the average number of fire-related casualties per year is 3. The highest number of injuries - 10 took place in 2007, and the lowest - 1 in 2009. The data has a decreasing trend.
The average number of injuries per 1,000 fires is 25. This indicator was the highest - 52 in 2007, and the lowest 8 in 2009. The trend for casualties per 1,000 incidents is declining. Compared to the Iowa value the number of injuries per 1,000 fire incidents is much higher.
According to the data from the years 2002 - 2017 the average number of fire-related casualties per year is 3. The highest number of injuries - 10 took place in 2007, and the lowest - 1 in 2009. The data has a decreasing trend.
The average number of injuries per 1,000 fires is 25. This indicator was the highest - 52 in 2007, and the lowest 8 in 2009. The trend for casualties per 1,000 incidents is declining. Compared to the Iowa value the number of injuries per 1,000 fire incidents is much higher.Casualties per 1,000 incidents in Clinton, IA compared to nearest cities:
(Note: Based on data for all years, including only cities with at least 500 fire incidents)
| Clinton: | 26.7 |
| Morrison: | 2.0 |
| Savanna: | 3.9 |
| Bettendorf: | 20.4 |
| East Moline: | 6.8 |
| Colona: | 0.0 |
| Sterling: | 13.9 |
| Rock Falls: | 25.5 |
| Geneseo: | 0.0 |
 32.0% incidents where reported in the morning and 68.0% in the evening. The most fires (17.2%) took place on Saturday, and the least (12.3%) on Monday.
 Based on the 2,022 fires from years 2002 - 2017 most fires (11.5%) took place during April, and the least (6.7%) in February.
 Out of all 21,069 cases reported during the years 2002 - 2017, the most belonged to the categories: Rescue & EMS (61.7%), Service Call (11.9%), and Fire (9.6%).
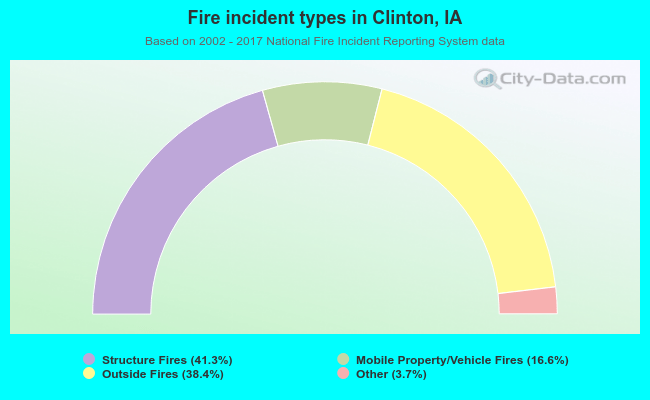 When looking into fire subcategories, the most reports belonged to: Structure Fires (41.3%), and Outside Fires (38.4%).