Chesterton: Fire Incidents, Indiana (IN)
Where are fire incidents reported in Chesterton, IN
Something went wrong! Please refresh the page.
|
| |||||||||||||||||||||||||||||||||||||||||||||||||||||||||||||||||||||||||||||||||||||||||||||||||||||||||||||
| Other | 39 | |||||||||||||||||||||||||||||||||||||||||||||||||||||||||||||||||||||||||||||||||||||||||||||||||||||||||||||
2002 - 2018 National Fire Incident Reporting System (NFIRS) incidents
- Incident types reported to NFIRS in Chesterton, IN
- 4,15656.5%Rescue & EMS
- 83511.4%Good Intent Call
- 77510.5%Hazardous Condition
- 6218.4%Fire
- 5868.0%Service Call
- 3735.1%False Alarm
- Fire incident types reported to NFIRS in Chesterton, IN
- 25240.6%Structure Fires
- 20933.7%Outside Fires
- 12820.6%Mobile Property/Vehicle Fires
- 325.2%Other
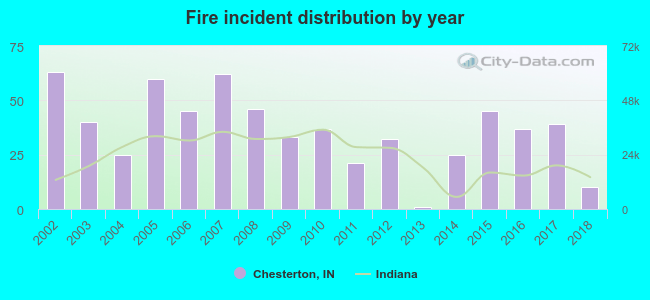 According to the data from the years 2002 - 2018 the average number of fire incidents per year is 37. The highest number of reported fires - 63 took place in 2002, and the least - 1 in 2013. The data has a dropping trend.
The average number of yearly fire incidents per 10k residents in Chesterton, IN compared to nearest cities:
(Note: Based on data for the last 3 years, including only cities with population 5,000 and above)
| Chesterton: | 21.4 |
| South Haven: | 8.5 |
| Portage: | 16.1 |
| Valparaiso: | 30.9 |
| Westville: | 23.5 |
| Lake Station: | 22.2 |
| Michigan City: | 40.5 |
| Hobart: | 1.4 |
| Gary: | 11.3 |
 The median response time based on all reported fire incidents is 6 minutes. This is comparable to the state median value.
The median response time in Chesterton, IN compared to nearest cities:
(Note: Based on data for all years, including only cities with at least 500 fire incidents)
| Chesterton: | 6 minutes |
| Portage: | 6 minutes |
| Valparaiso: | 6 minutes |
| Lake Station: | 7 minutes |
| Michigan City: | 5 minutes |
| Hobart: | 5 minutes |
| Gary: | 5 minutes |
| Merrillville: | 5 minutes |
| La Porte: | 3 minutes |
 Based on the reports from the years 2002 - 2018 the average number of fire-related fatalities per year is 0. The highest number of deaths - 1 took place in 2002, and the lowest - 0 in 2003. The data has a declining trend.
 35.7% incidents where reported in the morning and 64.3% in the evening. The most fires (15.9%) took place on Saturday, and the least (11.9%) on Monday.
 According to the 621 incident reports from years 2002 - 2018 most fires (11.3%) took place during October, and the least (3.9%) in December.
 Out of all 7,355 cases reported during the years 2002 - 2018, the most belonged to the categories: Rescue & EMS (56.5%), Good Intent Call (11.4%), and Hazardous Condition (10.5%).
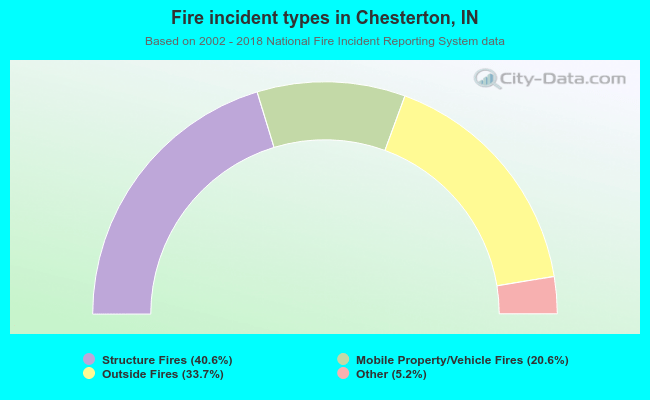 When looking into fire subcategories, the most incidents belonged to: Structure Fires (40.6%), and Outside Fires (33.7%).