Chandler: Fire Incidents, Arizona (AZ)
Where are fire incidents reported in Chandler, AZ
Something went wrong! Please refresh the page.
| Fire incidents reported | |
|---|---|
| Sreet name | Count |
| ARIZONA AV | 394 |
| CHANDLER BL | 362 |
| ALMA SCHOOL RD | 284 |
| RAY RD | 266 |
| DOBSON RD | 208 |
| MCQUEEN RD | 176 |
| CHANDLER BL | 156 |
| ARIZONA AV | 136 |
| A202 SANTAN | 122 |
| FRYE RD | 120 |
| PRICE RD | 92 |
| GALVESTON ST | 88 |
| HARTFORD ST | 76 |
| COOPER RD | 74 |
| OAKLAND ST | 74 |
| UNKNOWN | 74 |
| EVERGREEN ST | 72 |
| GERMANN RD | 72 |
| GILBERT RD | 72 |
| WARNER RD | 72 |
| PALOMINO DR | 70 |
| A101 | 68 |
| BOSTON ST | 68 |
| CALIFORNIA ST | 68 |
| DELAWARE ST | 68 |
| QUEEN CREEK RD | 64 |
| ERIE ST | 62 |
| PECOS RD | 60 |
| IVANHOE ST | 58 |
| HAMILTON ST | 56 |
| Other | 910 |
2004 - 2018 National Fire Incident Reporting System (NFIRS) incidents
- Incident types reported to NFIRS in Chandler, AZ
- 57,11467.7%Rescue & EMS
- 9,51311.3%Good Intent Call
- 7,5298.9%Service Call
- 4,5425.4%Fire
- 3,3203.9%False Alarm
- 2,1652.6%Hazardous Condition
- 1650.2%Special Incident
- Fire incident types reported to NFIRS in Chandler, AZ
- 2,15247.4%Structure Fires
- 1,17025.8%Outside Fires
- 67414.8%Mobile Property/Vehicle Fires
- 54612.0%Other
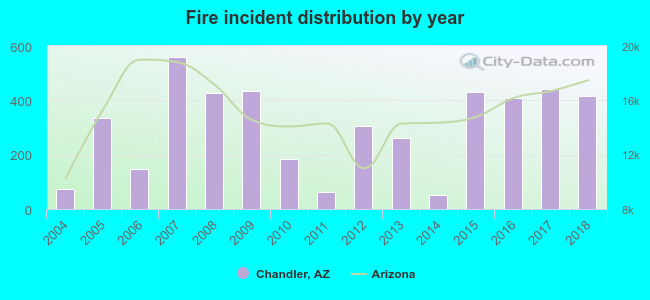 According to the data from the years 2004 - 2018 the average number of fire incidents per year is 303. The highest number of fire incidents - 558 took place in 2007, and the least - 50 in 2014. The data has a rising trend.
The average number of yearly fire incidents per 10k residents in Chandler, AZ compared to nearest cities:
(Note: Based on data for the last 3 years, including only cities with population 5,000 and above)
| Chandler: | 16.6 |
| Sun Lakes: | 19.1 |
| Gilbert: | 12.8 |
| Tempe: | 29.2 |
| Guadalupe: | 9.3 |
| Mesa: | 21.6 |
| Queen Creek: | 21.4 |
| Gila River: | 1.4 |
| Salt River: | 1.1 |
 The median response time based on all reported fire incidents is 5 minutes. This is close to the state median value.
The median response time in Chandler, AZ compared to nearest cities:
(Note: Based on data for all years, including only cities with at least 500 fire incidents)
| Chandler: | 5 minutes |
| Gilbert: | 5 minutes |
| Tempe: | 4 minutes |
| Mesa: | 5 minutes |
| Queen Creek: | 6 minutes |
| Apache Junction: | 6 minutes |
| Phoenix: | 4 minutes |
| Scottsdale: | 5 minutes |
| Glendale: | 4 minutes |
 Based on the reports from the years 2004 - 2018 the average number of fire-related fatalities per year is 0. The highest number of reported deaths - 2 took place in 2013, and the lowest - 0 in 2004. The data has a constant trend.
The average number of deaths per 1,000 fires is 1. This indicator was the highest - 8 in 2013, and the lowest 0 in 2004. The trend for fatalities per 1,000 fires is constant. Compared to the state value the number of fatalities per 1,000 incidents is higher.
Based on the reports from the years 2004 - 2018 the average number of fire-related fatalities per year is 0. The highest number of reported deaths - 2 took place in 2013, and the lowest - 0 in 2004. The data has a constant trend.
The average number of deaths per 1,000 fires is 1. This indicator was the highest - 8 in 2013, and the lowest 0 in 2004. The trend for fatalities per 1,000 fires is constant. Compared to the state value the number of fatalities per 1,000 incidents is higher.Deaths per 1,000 incidents in Chandler, AZ compared to nearest cities:
(Note: Based on data for all years, including only cities with at least 2,500 fire incidents)
| Chandler: | 0.9 |
| Gilbert: | 0.3 |
| Tempe: | 1.1 |
| Mesa: | 0.9 |
| Phoenix: | 0.0 |
| Scottsdale: | 0.0 |
| Glendale: | 0.4 |
| Casa Grande: | 1.1 |
| Peoria: | 0.3 |
 Based on the data from the years 2004 - 2018 the average number of fire-related casualties per year is 1. The highest number of injuries - 3 took place in 2007, and the lowest - 0 in 2004. The data has a growing trend.
The average number of injuries per 1,000 fires is 1. This indicator was the highest - 5 in 2007, and the lowest 0 in 2004. The trend for injuries per 1,000 incidents is growing. Compared to the Arizona value the number of casualties per 1,000 fires is much lower.
Based on the data from the years 2004 - 2018 the average number of fire-related casualties per year is 1. The highest number of injuries - 3 took place in 2007, and the lowest - 0 in 2004. The data has a growing trend.
The average number of injuries per 1,000 fires is 1. This indicator was the highest - 5 in 2007, and the lowest 0 in 2004. The trend for injuries per 1,000 incidents is growing. Compared to the Arizona value the number of casualties per 1,000 fires is much lower.Casualties per 1,000 incidents in Chandler, AZ compared to nearest cities:
(Note: Based on data for all years, including only cities with at least 500 fire incidents)
| Chandler: | 1.8 |
| Gilbert: | 5.0 |
| Tempe: | 8.7 |
| Mesa: | 15.7 |
| Queen Creek: | 1.5 |
| Apache Junction: | 25.6 |
| Phoenix: | 0.0 |
| Scottsdale: | 2.6 |
| Glendale: | 1.9 |
 32.4% incidents where reported in the morning and 67.6% in the evening. The most fires (15.7%) took place on Monday, and the least (13.0%) on Thursday.
 Based on the 4,542 fire incident reports from years 2004 - 2018 most fires (9.8%) took place during July, and the least (6.4%) in September.
 Out of all 84,367 cases reported during the years 2004 - 2018, the most belonged to the categories: Rescue & EMS (67.7%), Good Intent Call (11.3%), and Service Call (8.9%).
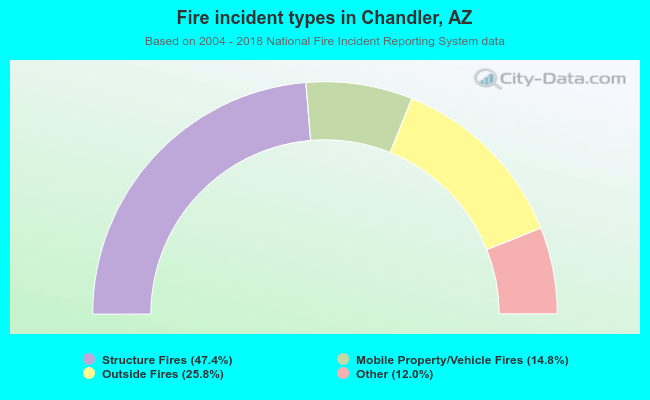 When looking into fire subcategories, the most reports belonged to: Structure Fires (47.4%), and Outside Fires (25.8%).