Carteret: Fire Incidents, New Jersey (NJ)
Where are fire incidents reported in Carteret, NJ
Something went wrong! Please refresh the page.
| Fire incidents reported | |
|---|---|
| Sreet name | Count |
| ROOSEVELT AVE | 502 |
| CARTERET AVE | 86 |
| PERSHING AVE | 60 |
| WASHINGTON AVE | 56 |
| UNION ST | 50 |
| MIDDLESEX AVE | 46 |
| MINUE ST | 42 |
| NJ TPKE | 42 |
| LOWELL ST | 36 |
| BLAIR RD | 34 |
| INDUSTRIAL AVE | 34 |
| LONGFELLOW ST | 34 |
| NEW JERSEY TPKE | 34 |
| EMERSON ST | 32 |
| ESSEX ST | 32 |
| BERGEN ST | 30 |
| RANDOLPH ST | 30 |
| FEDERAL BLVD | 26 |
| GRANT AVE | 24 |
| LAFAYETTE ST | 24 |
| LINCOLN AVE | 24 |
| NJTP | 24 |
| POST BLVD | 24 |
| NOE ST | 22 |
| PULASKI AVE | 22 |
| ROOSEVELT AVE | 22 |
| STIMA AVE | 22 |
| WEDGEWOOD DR | 22 |
| ABBY RD | 20 |
| LOUIS ST | 20 |
2003 - 2018 National Fire Incident Reporting System (NFIRS) incidents
- Incident types reported to NFIRS in Carteret, NJ
- 7,29251.9%Rescue & EMS
- 2,17315.5%Service Call
- 2,12915.2%Hazardous Condition
- 1,3449.6%Fire
- 8055.7%False Alarm
- 2261.6%Good Intent Call
- 360.3%Special Incident
- 340.2%Overpressure Rupture
- Fire incident types reported to NFIRS in Carteret, NJ
- 65949.0%Structure Fires
- 45233.6%Outside Fires
- 19314.4%Mobile Property/Vehicle Fires
- 403.0%Other
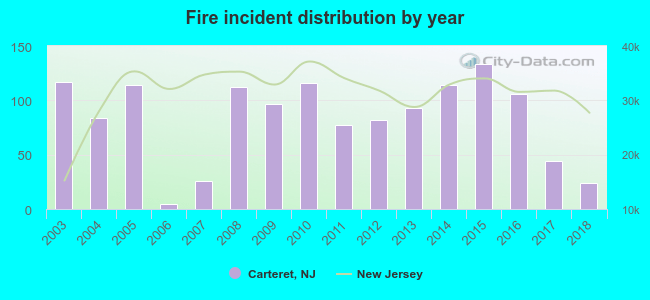 According to the data from the years 2003 - 2018 the average number of fire incidents per year is 84. The highest number of fires - 133 took place in 2015, and the least - 5 in 2006. The data has a declining trend.
The average number of yearly fire incidents per 10k residents in Carteret, NJ compared to nearest cities:
(Note: Based on data for the last 3 years, including only cities with population 5,000 and above)
| Carteret: | 24.1 |
| Avenel: | 25.3 |
| Rahway: | 51.8 |
| Woodbridge: | 34.1 |
| Linden: | 28.5 |
| Colonia: | 16.5 |
| Iselin: | 22.5 |
| Clark: | 30.3 |
| Perth Amboy: | 32.8 |
 The median response time based on all reported fire incidents is 3 minutes. This is lower than the state median value.
The median response time in Carteret, NJ compared to nearest cities:
(Note: Based on data for all years, including only cities with at least 500 fire incidents)
| Carteret: | 3 minutes |
| Avenel: | 4 minutes |
| Rahway: | 3 minutes |
| Woodbridge: | 5 minutes |
| Linden: | 4 minutes |
| Colonia: | 5 minutes |
| Iselin: | 5 minutes |
| Clark: | 6 minutes |
| Perth Amboy: | 4 minutes |
 According to the data from the years 2003 - 2018 the average number of fire-related casualties per year is 1. The highest number of casualties - 2 took place in 2003, and the lowest - 0 in 2004. The data has a decreasing trend.
The average number of casualties per 1,000 fires is 4. This indicator was the highest - 18 in 2008, and the lowest 0 in 2004. The trend for injuries per 1,000 fires is declining. Compared to the state value the number of injuries per 1,000 fires is lower.
According to the data from the years 2003 - 2018 the average number of fire-related casualties per year is 1. The highest number of casualties - 2 took place in 2003, and the lowest - 0 in 2004. The data has a decreasing trend.
The average number of casualties per 1,000 fires is 4. This indicator was the highest - 18 in 2008, and the lowest 0 in 2004. The trend for injuries per 1,000 fires is declining. Compared to the state value the number of injuries per 1,000 fires is lower.Casualties per 1,000 incidents in Carteret, NJ compared to nearest cities:
(Note: Based on data for all years, including only cities with at least 500 fire incidents)
| Carteret: | 6.0 |
| Avenel: | 4.7 |
| Rahway: | 8.9 |
| Woodbridge: | 15.2 |
| Linden: | 11.6 |
| Colonia: | 5.7 |
| Iselin: | 5.1 |
| Clark: | 14.5 |
| Perth Amboy: | 45.4 |
 30.9% incidents where reported in the morning and 69.1% in the evening. The most fires (16.3%) took place on Monday, and the least (11.8%) on Wednesday.
 According to the 1,344 fire incident reports from years 2003 - 2018 most fires (10.7%) took place during April, and the least (5.6%) in December.
 Out of all 14,045 cases reported during the years 2003 - 2018, the most belonged to the categories: Rescue & EMS (51.9%), Service Call (15.5%), and Hazardous Condition (15.2%).
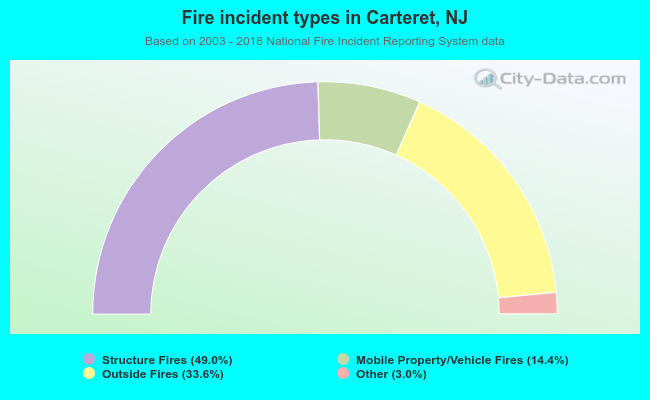 When looking into fire subcategories, the most incidents belonged to: Structure Fires (49.0%), and Outside Fires (33.6%).